Citation:
Longmei Liang, Cong Luo, Lingting Ye, Chaoyang Tu, Kui Xie. Porous magnesium oxide single crystal with Pt-loaded nanoparticles to boost ethane dehydrogenation[J]. Chinese Chemical Letters,
2026, 37(8): 111327.
doi:
10.1016/j.cclet.2025.111327
Porous magnesium oxide single crystal with Pt-loaded nanoparticles to boost ethane dehydrogenation
English
Porous magnesium oxide single crystal with Pt-loaded nanoparticles to boost ethane dehydrogenation
College of Chemistry and Materials Science, Fujian Normal University, Fuzhou 350117, China
b.
Fujian Institute of Research on the Structure of Matter, Chinese Academy of Sciences, Fuzhou 350108, China
c.
Strait Laboratory of Flexible Electronics (SLoFE), Fujian Key Laboratory of Flexible Electronics, Strait Institute of Flexible Electronics (Future Technologies), Fujian Normal University, Fuzhou 350117, China
d.
School of Mechanical Engineering, Shanghai Jiao Tong University, Shanghai 200240, China
e.
Fujian College, University of Chinese Academy of Sciences, Fuzhou 350108, China
Received Date:
27 February 2025 Accepted Date:
15 May 2025 Revised Date:
06 May 2025 Available Online:
15 August 2026
Abstract:
Porous single crystal (PSC) materials have a large specific surface area, higher structural stability, and more active sites by combining porosity and structural coherence, which provide a clear advantage in the field of catalysis. Platinum-based catalysts are precious metal catalysts commonly used in the dehydrogenation of low-carbon alkanes, with excellent dehydrogenation activity and good catalytic activity for the anaerobic dehydrogenation of ethane. By lattice reconstruction strategy we grow PSC MgO from the parent MgF2 single crystal and load Pt nanoparticles on its surface for growing PSC Pt/MgO. Oxygen vacancies are introduced by constructing active sites on a clear surface structure, which improve catalytic activity and durability. The PSC Pt/MgO catalyst for the direct dehydrogenation of ethane achieves an ethane conversion rate of approximately 28% and ethylene selectivity of over 97%, with good stability over 100 h. The present work offers significant value for the growth and application of porous single crystal oxides loaded with metal nanoparticles.
Ethylene is an essential component in the production of petrochemicals, and industrial-scale ethylene production is mainly produced through naphtha steam cracking [1–3]. Using ethane as a feedstock to produce ethylene through ethane dehydrogenation is a promising pathway for non-petroleum ethylene production, with the advantages of saving energy consumption, deducing separation costs, and increasing ethylene yields [4–6]. At present, ethane dehydrogenation is mainly divided into three ways: Steam cracking, oxidative dehydrogenation (ODH) and ethane dehydrogenation (EDH). Steam cracking for the production of ethylene is a complicated process with high energy consumption and is prone to environmental pollution. The oxidative dehydrogenation of ethane is challenging to control due to the deep oxidation reaction, and the selectivity of ethylene is low [7,8]. Direct dehydrogenation of ethane based on metal-loaded or oxide catalysts has attracted much attention in order to realize a more environmentally friendly mode of ethylene production [9–11]. Direct dehydrogenation of ethane is an endothermic reaction, and the temperature required for direct dehydrogenation of ethane is lower than that required for ethane steam cracking. Direct dehydrogenation of ethane has the advantage of high selectivity but also faces challenges of low conversion rates and instability [12]. Therefore, the construction of suitable catalytic dehydrogenation catalysts to maximize the one-way conversion of ethane and minimize energy consumption is the key to ethane dehydrogenation.
MgO is a common alkaline oxide carrier and support material, and one of the most important metal oxides in catalysis. In the hydrogenation of short-chain alkanes, attempts have been made to improve the catalytic properties of MgO through the promotion of other metals [13]. Precious metal catalysts have been extensively studied for their excellent alkane dehydrogenation activity and stability. Among them, most of the studies on direct dehydrogenation catalysts for ethane have focused on Pt-based catalytic systems [14,15]. Pt-based catalysts excel in activating the C—H bond of chain alkanes while effectively preventing the cleavage of the C—C bond, thereby avoiding hydrogenolysis reactions. Their excellent hydrogenation and dehydrogenation activities contribute to superior catalytic performance in the dehydrogenation of low-carbon alkanes [16–19]. Besides, compared with other noble metal-based catalysts, Pt-based catalysts present many advantages such as faster reaction rate, long working cycle before regeneration, high olefin selectivity and high reaction stability, and environmental friendliness [12,20]. Active metal-oxide interfaces can be formed by loading metal particles on metal oxides, which can enhance the activity of catalytic reactions [21].
Zeolites as porous materials offer promising catalysts for alkane dehydrogenation processes due to their rigid skeleton and ordered pore channels [22,23]. Single crystal materials are characterized by long-range ordering and absence of grain boundaries, which can effectively suppress charge scattering and energy loss, and exhibit good thermal stability [24,25]. Porous single crystal materials combine porosity and structural coherence by introducing a pore structure within the single crystal structure. Compared to conventional catalytic materials, it has significant advantages in the field of catalysis due to its large specific surface, stable structure, and more active centers [26,27]. Not only can the stability of the catalyst and the utilization of precious metals be increased, but the conversion rate of the catalytic reaction can also be improved, thereby reducing the energy loss during the reaction. The formation of oxygen vacancies on the surface of metal oxides, as one of the most important defects capable of participating in catalytic reactions, promotes the alkane dehydrogenation reaction [28,29]. Well-defined surfaces and oxygen vacancies are effective in improving the activation of C—H bonds and coking resistance in C2H6 [30]. The surface structure of oxygen vacancies with unsaturated coordination sites facilitates ethane adsorption and activation [31]. The reduction treatment of PSC Pt/MgO introduces oxygen vacancies and forms electronic defects. This promotes the adsorption of ethane molecules by the catalyst and increases the active sites, thereby enhancing the catalytic activity and selectivity of PSC Pt/MgO with oxygen vacancies for the non-oxidative dehydrogenation of ethane to ethylene [32]. The porous single crystal material combines the advantages of single crystal stability and porous structure, and the presence of single crystal skeleton stabilizes its constructed oxygen vacancies, which synergistically allow the PSC Pt/MgO to maintain high activity during long time testing [33].
In this work, we first grow single crystal magnesium fluoride. The growth of PSC MgO is achieved by introducing pores through the lattice reconstruction strategy, which increases the specific surface area inside the single crystal and provides a larger space for chemical reactions thus further enhancing the catalytic performance. PSC Pt/MgO is prepared by loading Pt nanoparticles onto the surface of PSC MgO by atomic layer deposition (ALD). The introduction of oxygen vacancies not only enhances the activity of the catalyst but also improves its durability [30]. PSC Pt/MgO enhances both conversion rates and selectivity in direct ethane dehydrogenation reactions, demonstrating durability for up to 100 h.
Growth of single crystal MgF2: The parent single crystal MgF2 is grown by the Bridgman-Stockbarge method [34]. The new graphite crucible is fired in vacuo and held at 1450 ℃ for 24 h before crystal growth. Put the raw material of magnesium fluoride in the graphite crucible, cover the graphite lid and load the furnace. High vacuum is maintained throughout the process. When the temperature is raised to 300 ℃, it is held at a constant temperature for 12 h. Heating is continued to raise the temperature to about 40 ℃ above the melting point of MgF2, and the temperature begins to decline after being held at a constant temperature for 10 h. The rate of descent is 0.36 mm/h and stop after descending to 10 cm. The rate of descent is 15 ℃/h to room temperature. The MgF2 crystals obtained are 10 cm in length and 2 cm in diameter. Then cut and polish.
Preparation of PSC MgO and PSC Pt/MgO: PSC MgO is synthesized by placing the MgF2 single crystal precursor in a chemical vapor deposition (CVD) furnace, flowing a mixture of 5% oxygen and 95% argon at a rate of 100 sccm, maintaining the pressure between 10 and 100 Torr, and annealing at a constant temperature of 900–1000 ℃ for 50 h. Pt nanoparticles are loaded on PSC MgO monoliths by ALD method. MeCpPtMe3 is used as a precursor and O3 as an oxidant during the deposition process. The PSC MgO monolith is placed in the center of a stainless steel chamber at 150 ℃. The vaporized MeCpPtMe3 precursor is injected into the chamber for 60 s, and O3 is injected into the chamber for 30 s and contact with PSC MgO for 30 s. The above process is repeated in 20, 40 and 60 cycles through the ALD technique, which correspond to a total time of 3000, 6000 and 9000 s, respectively. The above samples are placed in a chemical vapor deposition furnace and reduced in H2 atmosphere at 400 ℃ for 5 h. Three different Pt loading ratios of PSC Pt/MgO are obtained.
Characterization: The phase composition as well as the crystallographic orientation of the samples are analyzed by X-ray diffraction (XRD, MiniFlex 600). Scanning electron microscopy (SEM, SU-8010) is used to observe the porous structure on the surface of magnesium oxide single crystals. The micromorphology as well as the lattice orientation of the crystals are characterized using transmission electron microscopy (TEM, Talos-F200X). The average pore size and specific surface area of porous single crystals are determined by a specific surface and porosity analyser (BET, ASAP2020). The valence states of elements are determined using X-ray photoelectron spectroscopy (XPS, ESCALAB 250Xi). In order to obtain the pattern of the test reaction system with temperature, in-situ infrared spectroscopy (in-situ IR, Bruker Vertex-70 V) is used. Inductively coupled plasma (ICP, Avio220Max) emission spectroscopy is used to determine the weight ratio of metallic elements. Electron paramagnetic resonance (EPR, ELEXSYS E500) is used to detect signals from oxygen vacancies. The Raman spectra of the samples are measured by Raman spectrometer (Raman, LabRAM HR Evolution) at room temperature.
Catalyst performance test: Load 50 mg of samples into each flow-through quartz microreactor which the inner diameter is 5 mm. Heat the microreactors to 600 ℃ at a constant rate of 5 ℃/min. A flow-type quartz microreactor is fed with a reaction gas consisting of ethane and argon at a flow rate of 10 sccm, and ethane is dehydrogenated to ethylene at atmospheric pressure. The concentration of ethane in the reaction gas is 10.0 × 10⁻² mol/mol and argon is the equilibrium gas. The airspeed is 12,000 mL g-1 h-1. The composition of the exhaust gas is analyzed using an online gas chromatograph (GC-2014, Shimadzu) fitted with a flame ionization detector and a thermal conductivity detector. The temperature range for the reaction is 600–700 ℃.
Ethane conversion (C(C2H6)(%)) and ethylene selectivity (S(C2H4) (%)) are calculated by the following equations:
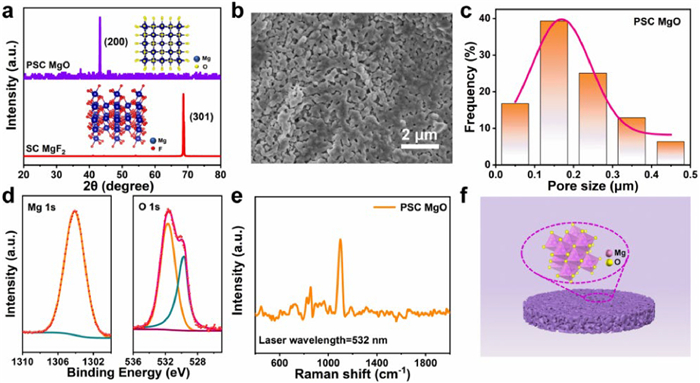
Fig. 1a displays the X-ray diffractograms of single crystal MgF2 and PSC MgO, with the diffraction peaks at 68.68° and 43.23° corresponding to the (301) plane of MgF2 and the (200) plane of MgO, respectively. Single crystal MgF2 exhibits a tetragonal structure with the space group P42/mnm (136), characterized by lattice parameters a = b = 4.615 Å and c = 3.043 Å. In contrast, single crystal MgO possesses a cubic structure with the space group Fm-3m (225), featuring lattice parameters a = b = c = 4.2 Å. Their diffraction peaks are high and sharp and have no extra stray peaks, which indicates that we have grown perfect single crystal MgF2 and PSC MgO with strong single-crystalline properties. The porosity of PSC MgO is calculated to be 42.8%. During the growth of PSC MgO, the fluorine atoms in the parent single crystal MgF2 are volatilized in the chemical vapor deposition furnace, and the oxygen atoms in the atmosphere are combined with the remaining magnesium atoms to form magnesium oxide (Fig. S1 in Supporting information). Fig. S2 (Supporting information) shows a scanning electron microscope image of the parent single crystal MgF2, and we can see that it is non-porous. The EDS energy spectrum and elemental mappings of the single crystal MgF2 monolith, as shown in Fig. S3 (Supporting information), reveal that the atomic ratios of magnesium to fluorine are consistent with those in the MgF2 molecule. To obtain the crystal orientation and microstructure of the parent crystal MgF2, we characterize it using field emission transmission electron microscopy (FETEM) and high-resolution transmission electron microscopy (HRTEM) (Fig. S4 in Supporting information). The microscopic morphology of the parent crystal MgF2 is demonstrated through Fig. S4a. The crystal orientation is determined by the facet spacing, as illustrated in Fig. S4b. The crystal face spacings are 0.20 nm and 0.22 nm, corresponding to the (210) and (111) planes of MgF2, respectively. We can see in Fig. S4c that the Mg element is uniformly distributed with the F element on the MgF2 surface. Selected area electron diffraction patterns indicate that the parent crystal MgF2 has good single-crystallinity (Fig. S4d). Fig. S5 (Supporting information) presents the photoelectron spectra of the parent crystal MgF2, with a binding energy of 1305.2 eV for Mg, which is related to the Mg-F-Mg bond, and 685.7 eV for F, which belongs to the F 1s [35]. The Raman spectrum of MgF2 is detected by a 532 nm wavelength laser as shown in Fig. S6 (Supporting information), and the observed vibrational modes of the two Raman peaks at 291.3 and 404.1 cm-1 correspond to Eg and A1g, respectively [36]. Fig. 1b demonstrates the scanning electron microscope image of PSC MgO, and we can clearly observe that the surface has a disordered pore structure. Fig. S7 (Supporting information) shows the nitrogen adsorption desorption isotherms of PSC MgO. Brunauer-Emmett-Teller (BET) analysis reveals that the specific surface area of the PSC MgO is measured to be 10.31 m2/g. The pore size of PSC MgO is measured using Nano Measurer for Fig. 1b, and the pore size distribution of PSC MgO is obtained by Gaussian fitting (Fig. 1c), with pore sizes ranging from 100 nm to 500 nm, and the highest frequency of pores in the 100–200 nm range. By XPS we analyzed the valence states of the chemical elements (Fig. 1d). The peak at 1304.2 eV, corresponding to the Mg 1s binding energy, indicates that Mg is present in the fully oxidized state (+2) within MgO. The two peaks of O 1s, located at binding energies of 531.7 and 529.7 eV, represent oxygen vacancies and lattice oxygen, respectively [37]. The oxygen vacancy ratio of PSC MgO calculated from the peak area is 60.65% and the ratio of lattice oxygen is 39.35%. Fig. 1e displays the Raman spectra of PSC MgO, measured within the wavenumber range of 400–2000 cm-1 using a 532 nm laser [38]. Fig. 1f shows a simulation of PSC MgO and we can see its structure.
Figure 1
Figure 1.
(a) XRD patterns of single crystal MgF2 and PSC MgO, with insets showing the structures of single crystal MgF2 and PSC MgO. (b) SEM image of PSC MgO. (c) Pore size distribution of PSC MgO. (d) XPS spectra of PSC MgO. (e) Raman spectra of PSC MgO. (f) Schematic representation of PSC MgO.
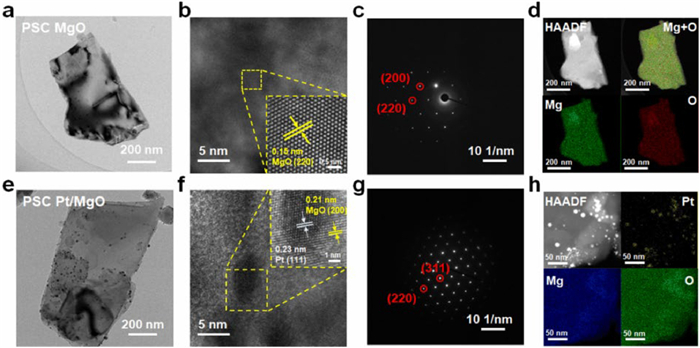
Figs. 2a-h show the FETEM images, HRTEM images, SAED patterns, HAADF-STEM images and elemental mappings of PSC MgO and PSC Pt/MgO, respectively. The loaded weight ratio of Pt in PSC Pt/MgO is 2.85%. Fig. 2a illustrates the microscopic morphology of PSC MgO. The crystallographic orientation of the PSC MgO is identified through high-resolution transmission electron microscopy, as illustrated in Fig. 2b. The observed lattice spacing of 0.15 nm is consistent with the (220) crystallographic plane of MgO. Fig. 2d demonstrates a uniform distribution of Mg and O elements across the PSC MgO surface, as observed through HAADF-STEM and elemental mappings. As shown in Fig. 2e, we can clearly see that Pt nanoparticles are successfully loaded on PSC MgO, and the size range of Pt nanoparticles is 2–26 nm. The particle size distribution of Pt nanoparticles of 2.85 wt% Pt is shown in Fig. S9e (Supporting information). Fig. 2f displays high-resolution transmission electron micrographs of PSC Pt/MgO, showing lattice spacings of 0.23 nm and 0.21 nm, which correspond to the (111) crystallographic plane of Pt and (200) crystallographic planes of MgO, respectively. Fig. 2h shows that the Pt element is distributed on the surface of the MgO while the magnesium and oxygen elements exhibit a uniform distribution. The mapping diagram of Pt nanoparticles can correspond well with the HAADF diagram. Selected area electron diffraction patterns demonstrate that PSC MgO and PSC Pt/MgO have good single-crystallinity (Figs. 2c and g). Three parallel sets of data are tested for loads with different contents of Pt. Means and standard deviations are calculated statistically. Fig. S8 (Supporting information) demonstrates the weight ratio of Pt nanoparticles in PSC Pt/MgO loaded with different time ALDs of 0.94 wt% Pt, 1.59 wt% Pt, 2.85 wt% Pt.
Figure 2
Figure 2.
(a) FETEM image, (b) HRTEM images, (c) SAED pattern, (d) HAADF-STEM image and elemental mappings of PSC MgO. (e) FETEM image, (f) HRTEM images, (g) SAED pattern, (h) HAADF-STEM image and elemental mappings of PSC Pt/MgO. The insets provide a magnified view of the HRTEM image.
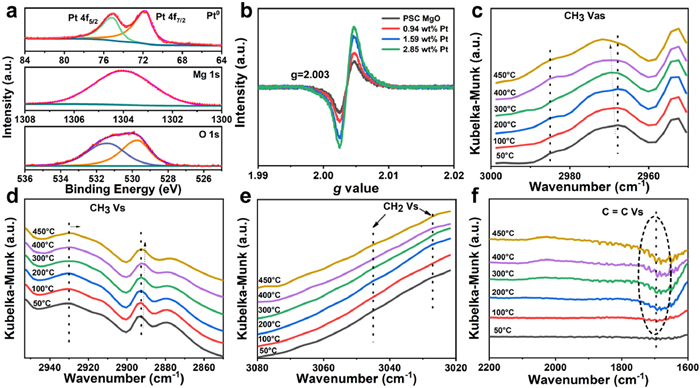
To ascertain the valence states of various elements, XPS is tested for PSC Pt/MgO (Fig. 3a). It is observed that Pt 4f has two splitting peaks, Pt 4f5/2 with a binding energy of 75.2 eV and Pt 4f7/2 with a binding energy of 71.8 eV, suggesting that the platinum is in the zero valence state [39]. Mg is in the oxidized state. The O 1s peak observed at a binding energy of 531.4 eV originates from oxygen vacancies, whereas the peak at 529.7 eV is ascribed to lattice oxygen. The oxygen vacancy ratio of PSC Pt/MgO is calculated to be 72.74% and the ratio of lattice oxygen is 27.26% by peak area. The oxygen vacancy ratio in PSC Pt/MgO is significantly increased compared to that in PSC MgO, which suggests that PSC Pt/MgO has a higher oxygen vacancy concentration than PSC MgO. Oxygen vacancies are vacancies that form in metal oxides or other oxygen-containing compounds when oxygen atoms in the lattice detach, resulting in an oxygen deficiency. The oxygen defect signals of the samples are detected by EPR (Fig. 3b). The g-value of 2.003 can be attributed to oxygen vacancies, indicating that the PSC Pt/MgO surface contains oxygen defects. It is also found that the oxygen vacancy signal of PSC MgO is not as strong as that of loaded Pt nanoparticles. The signal intensity of the oxygen vacancies is 2.85 wt% Pt, 1.59 wt% Pt, and 0.94 wt% Pt in descending order, which corresponds to their oxygen vacancy concentrations. PSC Pt/MgO contributes to the formation of oxygen defects by providing a well-defined surface structure to build active sites. The generation and concentration of oxygen vacancies in the catalyst can greatly increase the catalytic activity of the reaction [30]. Figs. 3c-f are the in-situ FTIR maps of PSC Pt/MgO loaded with 1.59 wt% Pt used to demonstrate the activation mechanism of ethane molecules on the catalyst. The peaks observed at approximately 2968 and 2985 cm-1 are attributed to the asymmetric stretching vibrations (ASV) of the C—H bonds in methyl groups. As the temperature increased, these peaks exhibited a blue shift, indicating that the C—H bond in the ethane molecule is effectively activated to a higher energy state (Fig. 3c) [32]. The ~2894 and 2930 cm-1 peaks illustrated in Fig. 3d originate from the symmetrical stretching vibration (SSV) of the C—H bond within the methyl group [40]. As illustrated in Figs. 3e and f, the peak intensities of the SSVs of C—H bonds (~3027 and 3045 cm-1) and C=C bonds (~1700 cm-1) in ethylene progressively increase with rising temperature. The telescoping vibrations are gradually visible at a temperature of 200 ℃, which indicates that the onset of nonoxidative dehydrogenation of ethane to ethylene occurs at temperatures as low as the surface temperature of about 200 ℃ [26]. The results of in situ FTIR spectroscopy indicate that the activity of PSC Pt/MgO is gradually activated, thereby enhancing the catalytic conversion of ethane to ethylene.
Figure 3
Figure 3.
(a) XPS spectrum of PSC Pt/MgO. (b) EPR spectra of PSC MgO, 0.94 wt% Pt, 1.59 wt% Pt, and 2.85 wt% Pt. (c-f) In-situ infrared spectroscopy of C—H bond (CH3) asymmetric stretching vibration, C—H bond (CH3) symmetric stretching vibration, C—H bond (CH2) symmetric stretching vibration, C=C bond symmetric stretching vibration of PSC Pt/MgO.
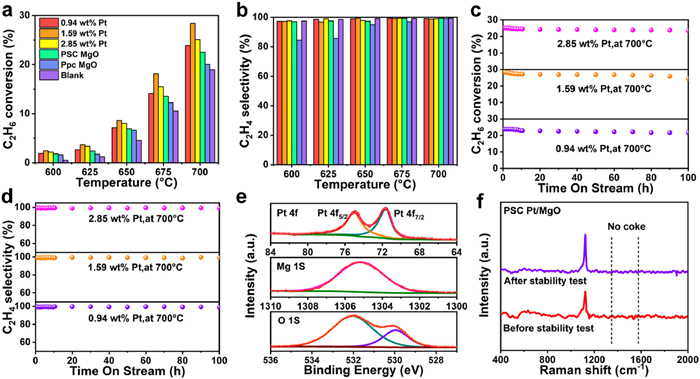
Ethane dehydrogenation efficiency, measured by ethane conversion and ethylene selectivity, is examined for 0.94 wt% Pt, 1.59 wt% Pt, 2.85 wt% Pt, porous polycrystalline MgO (PpC), PSC MgO and a blank sample at intervals of 25 ℃ within the temperature range of 600–700 ℃ (Figs. 4a and b). As the temperature increases, the ethane conversion is gradually improved, and we can see that the catalytic effect of 1.59 wt% Pt on the ethane dehydrogenation reaction is significantly better than others, and in addition, the ethylene selectivity of the porous single crystals generally reaches more than 97%. The ethane conversion of 0.94 wt% Pt, 1.59 wt% Pt, and 2.85 wt% Pt at 700 ℃ reached about 23%, 28%, and 25%, respectively. The calculated TOF value for 1.59 wt% Pt is 30.67 min-1. Figs. S9a and b (Supporting information) show the FETEM images of 0.94 and 1.59 wt% Pt, respectively. The particle size distributions of Pt nanoparticles with different Pt loadings (0.94, 1.59, and 2.85 wt%) are presented in Figs. S9c-e (Supporting information). Compared to the 0.94 wt% Pt catalyst, the 1.59 wt% Pt sample exhibits stronger ethane C—H bond activation due to the higher Pt loading. Meanwhile, the EPR spectra (Fig. 3b) show that the 1.59 wt% Pt sample has a higher peak oxygen vacancy characteristic signal. The ethane conversion of 0.94 wt% Pt is lower than that of 1.59 wt% Pt. As the platinum content increases, the average size of the platinum nanoparticles increases and the Pt surface area per unit weight of the sample decreases [41]. As shown in Fig. S9b, the 1.59 wt% Pt catalyst exhibits a relatively uniform distribution of Pt nanoparticles, demonstrating improved dispersion compared to the 2.85 wt% Pt sample in Fig. 2e. While well-dispersed Pt nanoparticles resist sintering, dense Pt nanoparticles readily agglomerate at high temperatures, resulting in diminished catalytic performance [12]. It can be seen that the conversion of 1.59 wt% Pt is higher than that of 2.85 wt% Pt. Long-term stability tests are then carried out on catalysts with different Pt weight ratios, as shown in Figs. 4c and d, where the ethane conversion remains stable even after more than 100 h of operation. In porous single crystals, the porous structure combines porosity and structural coherence, while the single-crystal skeleton minimizes energy loss at grain boundaries. The specific surface area of PSC Pt/MgO with three Pt loading contents is shown in Fig. S10 (Supporting information). We can see that 2.85 wt% has a larger specific surface area than 1.59 wt%. Fig. S11 (Supporting information) shows the CO2-TPD plots of PSC MgO and three different loadings of PSC Pt/MgO, where peaks are observed at three basicity sites (107, 306, and 495 ℃) of PSC MgO, which confirms that the PSC MgO is a typical solid substrate [21]. The TPD desorption peak area of 1.59 wt% Pt is greater than that of 2.85 wt% Pt, with a greater number of basic sites. A larger specific surface area, higher structural stability, and a greater number of active sites enhance ethane conversion and ethylene selectivity. The performance comparison of different catalysts in the direct dehydrogenation of ethane is presented in Table S1 (Supporting information). XPS characterization of PSC Pt/MgO after a long run of anaerobic dehydrogenation of ethane is carried out. As illustrated in Fig. 4e, the Pt 4f spectrum exhibits two distinct peaks with binding energies of 75.0 eV and 71.6 eV, the former attributed to the Pt 4f5/2 state and the latter to the Pt 4f7/2 state. Mg is still at the +2 valence. Fig. 4f shows the Raman characterization of PSC Pt/MgO before and after the ethane dehydrogenation reaction, no carbon signals are seen in the range of 1200–1600 cm-1, indicating that there is no serious carbon deposition or sintering on the catalyst surface [42]. The TEM image of PSC Pt/MgO after ethane dehydrogenation reaction is shown in Fig. S12 (Supporting information). We can clearly see the Pt nanoparticles on the surface of MgO, indicating the good stability of PSC Pt/MgO.
Figure 4
Figure 4.
(a) Ethane conversion, (b) ethylene selectivity of 0.94 wt% Pt, 1.59 wt% Pt, 2.85 wt% Pt, PSC MgO, porous polycrystalline MgO (PpC), and blank. (c, d) Long-term stability test of direct dehydrogenation of ethane at 700 ℃. (e) XPS spectra of PSC Pt/MgO after long-term testing. (f) Raman spectra of PSC Pt/MgO before and after long-term tests.
In conclusion, by lattice reconstruction strategy we grow porous single crystal MgO and load Pt nanoparticles on its surface for growing PSC Pt/MgO. PSC Pt/MgO introduces oxygen vacancies by reduction treatment to form electronic defects that enhance ethane adsorption and increase active sites. The ethane conversion achieves by PSC Pt/MgO in the direct dehydrogenation of ethane is 28%, with an ethylene selectivity exceeding 97%. Importantly, this process exhibits exceptional stability over a continuous operational period of 100 h. This work provides a preparative method for preparing platinum-based metal oxide catalysts while presenting a new idea for improving the conversion and long-term performance of non-oxidative dehydrogenation of ethane.
Declaration of competing interest
The authors declare that they have no known competing financial interests or personal relationships that could have appeared to influence the work reported in this paper.
We acknowledge the National Natural Science Foundation of China (Nos. 22325506 and 22379147), the Natural Science Foundation of Fujian Province (No. 2024J09052), the Shanghai Science and Technology Innovation Action Plan (No. 24TS1414400) and the Shanghai Jiao Tong University 2030 Initiative (No. 2030B24) and the Start-up Funding from Fujian Normal University (No. Y072R048K13) for funding this work.
Supplementary materials
Supplementary material associated with this article can be found, in the online version, at doi:10.1016/j.cclet.2025.111327.
[1]
R. Song, G. Zhao, J.M. Restrepo-Flórez, et al., Nat. Energy 9 (2024) 750–760. doi: 10.1038/s41560-024-01541-7
[2]
F.J. Guo, N. Yang, H.X. Li, et al., Chin. J. Struct. Chem. 42 (2023) 100012.
[3]
Q. Wang, D. Ning, H. Chen, et al., Chin. J. Struct. Chem. 42 (2023) 100147.
A. Pathak, S. Samanta, H. Donthula, et al., ACS Sens. 9 (2024) 6122–6135. doi: 10.1021/acssensors.4c01995
[38]
A. Muhaymin, H.E.A. Mohamed, K. Hkiri, et al., Sci. Rep. 14 (2024) 20135. doi: 10.1038/s41598-024-71149-0
[39]
E.C.M. Barbosa, L.S. Parreira, I.C. de Freitas, et al., ACS Appl. Energy Mater. 2 (2019) 5759–5768. doi: 10.1021/acsaem.9b00879
[40]
W. Zhao, K. Xie, New J. Chem. 47 (2023) 838–843. doi: 10.1039/D2NJ04258D
[41]
J. Yun, C.H. Jung, D. Park, et al., Korean J. Chem. Eng. 31 (2014) 1980–1984. doi: 10.1007/s11814-014-0144-x
[42]
S. Zhang, F. Cheng, K. Xie, Catal. Sci. Technol. 14 (2024) 681–688. doi: 10.1039/D3CY01560B
Figure 1
(a) XRD patterns of single crystal MgF2 and PSC MgO, with insets showing the structures of single crystal MgF2 and PSC MgO. (b) SEM image of PSC MgO. (c) Pore size distribution of PSC MgO. (d) XPS spectra of PSC MgO. (e) Raman spectra of PSC MgO. (f) Schematic representation of PSC MgO.
Figure 4
(a) Ethane conversion, (b) ethylene selectivity of 0.94 wt% Pt, 1.59 wt% Pt, 2.85 wt% Pt, PSC MgO, porous polycrystalline MgO (PpC), and blank. (c, d) Long-term stability test of direct dehydrogenation of ethane at 700 ℃. (e) XPS spectra of PSC Pt/MgO after long-term testing. (f) Raman spectra of PSC Pt/MgO before and after long-term tests.


 DownLoad:

 下载:
下载:


 下载:
下载:

