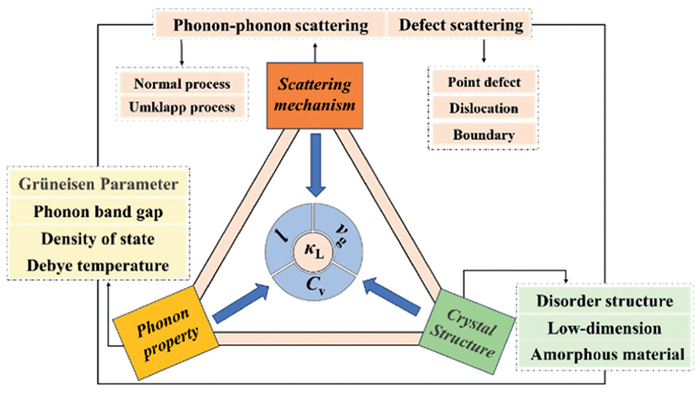
Figure 1.
Important factors of thermal conductivity in crystalline solids.

Zintl phase compounds ABSb: An emerging family of promising thermoelectric materials with low lattice thermal conductivity
Yujie Huang , Yuanxin Jiang , Chen Chen , Shuankui Li , Kai Guo


With the rapid advancement of modern industrialization, concepts like carbon neutrality, using carbon emissions as a metric, have emerged to safeguard the ecological environment and drive sustainable economic progress. In this context, thermoelectric materials [1–10], which can convert heat energy into electrical energy and vice versa, have significantly enhanced energy utilization efficiency. Thermoelectric devices [11–16] built upon these materials, including thermoelectric cooling devices [17–20] and thermoelectric power generators [21–23], are well-aligned with current energy trends. Hence, the advancement of thermoelectric devices and materials is pivotal in advancing energy conservation, reducing emissions, and achieving carbon neutrality.
Currently, the primary focus of thermoelectric research is to seek promising thermoelectric materials for constructing high-performance thermoelectric devices with high stability. This work normally involves the property optimization of conventional thermoelectric systems, and the discovery of new promising thermoelectric compounds [24–33]. The performance of thermoelectric materials is typically quantified by the figure of merit
Traditional thermoelectric materials began with narrow-band-gap semiconductors containing heavy elements such as Bi2Te3 [49–52], PbTe [46,53,54] and GeTe [55,56]. These compounds exhibited promising thermoelectric properties, good stability, and excellent mechanical properties, leading to important applications for the past fifty years in medium-temperature power generation and room-temperature cooling. In the 1990s, filled-skutterudites [57,58] emerged in the field of thermoelectric research due to their unique characteristics of "electron-crystal, phonon-glass" [59–61]. A multi-filled strategy with various elements at voids was developed to scatter phonons with different frequencies while maintaining good electrical transport performance. Over the past decade, single crystal SnSe [24,62–64] has gained recognition as a standout material in the thermoelectric community for its exceptional thermoelectric figure of merit zT. This material shows strong lattice anharmonicity, and the thermoelectric figure of merit zT can be largely enhanced by the regulation of carrier concentration, mobility and oxidation [65].
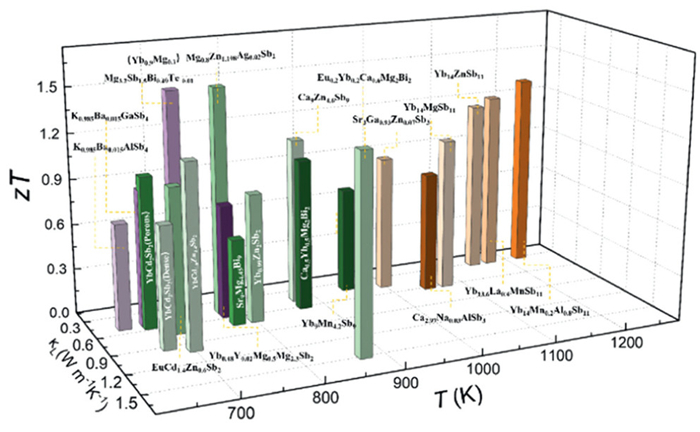
It was not until the early 21st century that scientists began to recognize the huge potential of Zintl compounds [66–69] as thermoelectric candidates. G. J. Snyder and collaborators reported the impressive thermoelectric properties of the Yb1-xCaZn2Sb2 solid solution, sparking heightened interest among thermoelectric researchers in these intriguing compounds [70]. Unlike traditional intermetallic compounds, Zintl phases possess both ionic and covalent bonding characteristics, resulting in structural complexity and diversity driven by the need for precise electronic equilibrium states. This distinctive feature often results in moderate electrical transport properties and inherently low thermal conductivity, aligning with the concept of "phonon-glass, electron-crystal". It indicates that the electrical and thermal transport properties can be relatively independently controlled by various building blocks, offering a pathway to designing high-performance thermoelectric materials through the strategic assembly of functional units. Over recent years, an increasing number of new Zintl series have been uncovered, revealing promising thermoelectric performance (Fig. 2) [71–88]. For example, materials belonging to the 1–2–2 type compounds [89] like YbZn2Sb2 [90,91], YbCd2Sb2 [73,92] and BaCu2Te2 [93,94], as well as the 14–1–11 series [95–97] such as Yb14MnSb11 [98] and Yb14MgSb11 [74], have demonstrated zT values exceeding 1.0. More recently, the 1–1–1 type Zintl phase materials have emerged as having exceptional thermoelectric properties due to their interesting complexion in crystal structure and chemical bonds. Members of the 1–1–1 series, such as Eu2ZnSb2 [99–101], SrAgSb [102], NaCdSb [103] and other antimony-based compounds [104–108], have attracted significant attention for their distinct structures, advantageous thermoelectric characteristics and considerable stability. Although the 1–1–1 series compounds did not achieve the optimal thermoelectric performance in the Zintl domain, they still possess considerable potential, making it highly valuable to summarize their structures and properties.
In the context of the progressive advancement of 1–1–1 series compounds, a growing number of constituents have demonstrated robust thermoelectric performance in this system. This review aims to offer a thorough analysis by consolidating and investigating the thermoelectric capabilities of specific 1–1–1 type members of Zintl phase compounds that have exhibited promising outcomes in recent years. Furthermore, it highlights the superiority of 1–1–1 type materials by delving into the mechanisms behind their low thermal conductivity, often below 1.0 W m-1 K-1, offering detailed insights into internal processes such as optical-acoustic branch coupling and unique disorder sublattice scattering that influence intrinsic thermal conductivity. Ultimately, this review seeks to expand the scope of understanding within the field of Zintl phase materials.
1–1–1 type Zintl phase thermoelectric materials typically exhibit intrinsically low thermal conductivities, with various materials demonstrating distinct mechanisms for achieving this kind of physical properties. These differences largely arise from variations in their structural characteristics and bonding. In this section, we will explore these diverse mechanisms of low thermal conductivity with materials displayed in Table 1 and emphasize the unique performance characteristics of typical materials in detail.

 DownLoad:
CSV
DownLoad:
CSV
| Year | 2018 | 2019 | 2020 | 2021 | 2022 | 2023 | 2024 |
| P63/mmc | Eu2ZnSb2 | SrAgSb | BaAgSb | BaCuSb | |||
| P63mc | CaZn0.4Ag0.18Sb | ||||||
| Pnma | SrLiSb | NaCdSb | |||||
| P4/nmm | KCdSb | ||||||
| Fm-3m | LiCdSb |
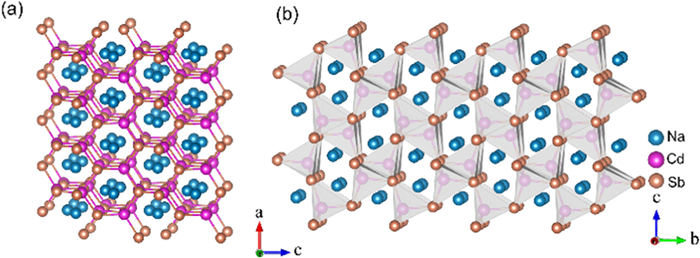
In Zintl phases, the three acoustic branches primarily arising from the vibrations of polyanionic frameworks, play a dominant role in determining thermal transport properties. The variety of bonding lengths and strengths of covalent bonds within anionic groups significantly impedes phonon diffusion and induces substantial lattice anharmonicity, resulting in ultralow lattice thermal conductivity. This case has been exemplified in 1–1–1 Zintl compound NaCdSb [103]. This compound was reported to crystalline into orthorhombic structure with space group of Pnma [109]. As illustrated in Fig. 3, each Cd atom is bonded with four Sb atoms to form an irregular tetrahedron with the bonding lengths of Cd-Sb varying from 2.863 Å to 2.976 Å. These tetrahedrons are interconnected through shared corners and edges. The fluctuation in the bond length and strength indicates the variation of force constant, following the formula 1/k = 1/k1 + 1/k2 + 1/k3 + …, where k represents the total force constant and ki (i = 1, 2, 3…) are the individual force constants. In this case, phonon diffusion would be significantly slowed due to the reduction of k, as described by the equation
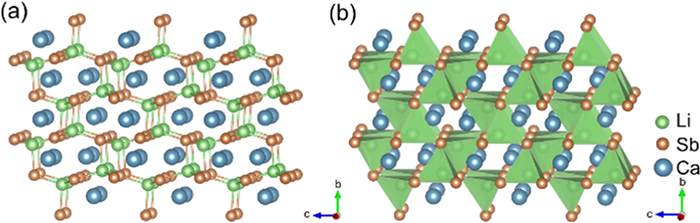
The ALiSb (A = Ca, Sr, Eu, Yb) series belong to TiNiSi phase with space group Pnma [111]. As shown in Fig. 4a, the anionic network of CaLiSb consists of main group atoms, and forms variable covalent bonding between Li and Sb atoms. The cations A are filled in the eight-membered rings and provide electrons to ensure the charge balance in Fig. 4b.
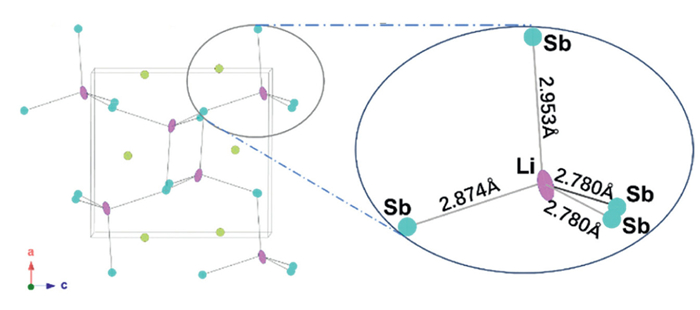
In 2022, Liu et al. [107] elucidated the mechanism behind the low lattice thermal conductivity observed in ALiSb. The Li atoms within the disordered tetrahedral structure of Sb exhibit significant thermal motion along the a-axis, likely due to the weak Li-Sb bonding in this orientation (Fig. 5). The Li-Sb distance has expanded to 2.953 Å, exceeding the other Li-Sb distances, resulting in the ALiSb anion layer behaving akin to folded [LiSb] layers. Consequently, the vibrational state of Li atoms within the "pseudo" polyanionic layer could influence phonon scattering.
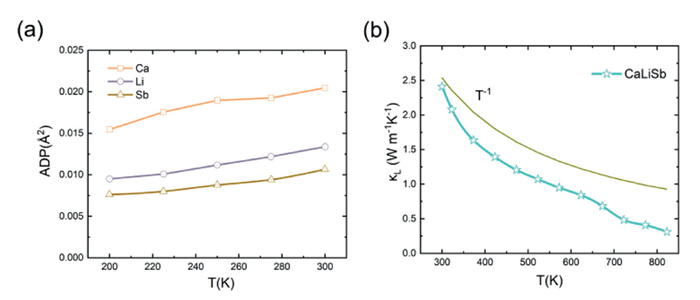
The atomic displacement parameters (ADPs) of Li atoms are notably larger than those of Ca and Sb atoms, as demonstrated in Fig. 6a [112]. These abnormally large ADP values may lead to intense phonon scattering, ultimately driving the lattice thermal conductivity lower than the corresponding 1/T curve (Fig. 6b).
The presence of a rattling-like behavior has been demonstrated in certain univalent-element-containing compounds lacking a cage-like structure [113,114], such as CsAg5Te3 [115], CuBi3S5 [116] and AgBi3S5 [117]. Consequently, the ultra-low κL in ALiSb compounds ranges only from 0.3 W m−1 K−1 to 0.6 W m−1 K−1. Notably, when compared to the typical TiNiSi-phase, ALiSb exhibited more favorable thermoelectric performance with a maximum zT of about 0.7 at 823 K and high zT value of 1.2 was realized in Sr0.8Eu0.2LiSb [118], challenging the previous notion that TiNiSi-type Zintl phases typically display poor thermoelectric properties [119,120].
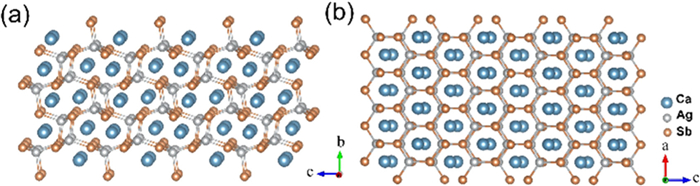
The archetypal CaAgSb compound also belongs to the TiNiSi-type phase, adopting the Pnma space group (Fig. 7). In comparison to the ZrBeSi structure, this slightly distorted TiNiSi-structure yields covalent interactions between anion layers. Nonetheless, CaAgSb has demonstrated a close relationship between the three typical crystal structures of ABX compounds. The intriguing structural transition phenomenon between the TiNiSi-type and LiGaGe-type structures, which occurs when trivalent cations are introduced to the calcium site or Zn2+ replaces Ag+ in the Ag site, has attracted significant attention [104,121,122]. However, the instinct thermoelectric performance of CaAgSb was primarily limited by its high hole concentration. In 2013, Wang et al. [122] successfully synthesized CaAgSb sample through the Pb-flux reactions method, and the prototype sample exhibited poor performance with a peak zT value below 0.2 within the temperature range of 300–800 K. In 2024, Shawon et al. [123] employed the ball-milling method to prepare the sample and managed to improve the zT value of CaAgSb to 0.47, which was accompanied by an ultra-low lattice conductivity of 0.44 W m-1 K-1 at 620 K. This remarkably low value can be primarily attributed to the weak bonding interactions between Ca atoms and their neighboring atoms, which originates from a distinctive electronic structure analogous to that of MgAgSb [124], resulting in significantly reduced sound velocity. Additionally, the pronounced thermal motion of Ag atoms combined with the relatively high average atomic mass collectively contribute to the unique thermal transport properties. While these mechanisms provide initial insights, the detailed underlying physics remains to be fully elucidated through further investigation. Furthermore, isostructural TiNiSi-type compounds, such as YbAgSb, exhibit similar characteristics and represent promising candidates for future systematic studies in this field.
The crystal structure of ZrBeSi-series compounds is commonly hexagonal, belonging to space group P63/mmc [125]. This structure incorporates additional cation layers between the anion layers, giving rise to a layered-like behavior. The extensive and well-ordered anion layers guarantee excellent electrical transport properties, while akin layered structure results in low lattice thermal conductivity due to low sound velocity and large lattice anharmonicity caused from weak bond connection and relatively isolated feature of cation sites. As a result, ZrBeSi-type phases often exhibit favorable thermoelectric performance. So far, research on antimony-based ZrBeSi-type compounds has mainly concentrated on two categories of compounds: AAgSb and ACuSb, as shown in Table 2.
DownLoad:
CSV
| Empty Cell | Ca | Sr | Ba | Eu |
| Cu | CaCuSb | SrCuSb | BaCuSb | EuCuSb |
| Ag | SrAgSb | BaAgSb | EuAgSb | |
| Au | SrAuSb* | BaAuSb* | EuAuSb* | |
| * indicates that the thermoelectric properties of this compound have not been studied. | ||||
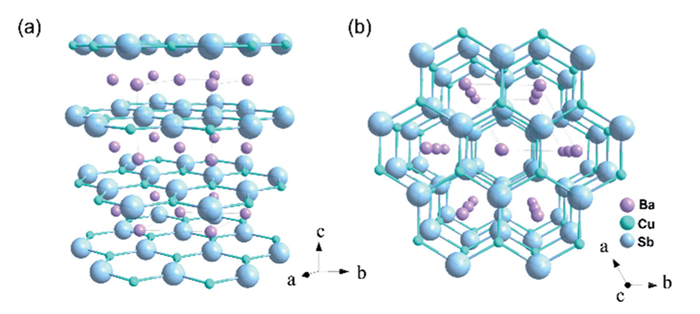
XCuSb (X = Ca, Sr, Ba) has long been recognized as an integral member of the ZiBeSi-type compounds. In 2022, Zheng et al. reported the physical properties of XCuSb series through a combination of systematic experimental investigations and theoretical calculations [108]. As a typical ZiBeSi-type compound, XCuSb features a unique crystal structure that consists of loosely packed mono-hexagonal layers containing ionically bonded X atoms, along with honeycomb layers of covalently bonded CuSb (Fig. 8). This distinctive crystal arrangement often results in weak interlayer interactions, which can lead to pronounced lattice vibrational anharmonicity. All three compounds demonstrated low lattice thermal conductivities at elevated temperatures of 1010 K, with BaCuSb achieving promising κtot (Fig. 9a) with the lowest κL value of 0.54 W m-1 K-1 in Fig. 9b. Two key factors contribute to this low conductivity: A low group velocity and a high phonon scattering rate.
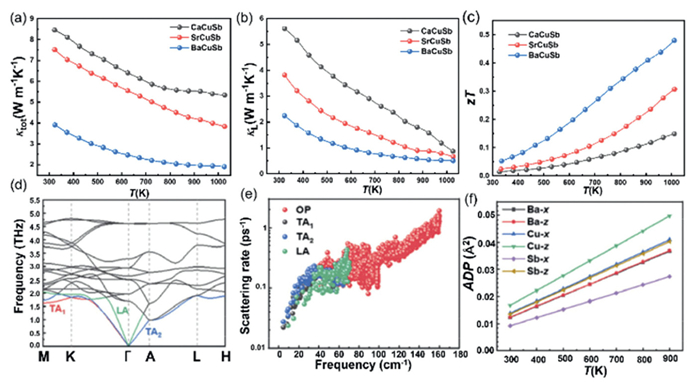
The highest occupied frequency along the high-symmetry lines approaches 5 THz, while the highest acoustic branch reaches only 2.0 THz in the phonon dispersion (Fig. 9d), indicating that BaCuSb exhibits a low phonon group velocity, ascribed to the weak connection both intralayer and interlayer directions of Ba cation layer. Experimental results further support this conclusion, revealing that the longitudinal (vl), transverse (vt), and mean (vs) sound velocities of BaCuSb are 3808, 2278, and 2521 m/s, is lower than SrCuSb which exhibited vl of 4255 m/s and vt of 2360 m/s. In particular, the ADPs of Ba are isotropic and relatively high, which confirms the weak bond features.
Moreover, the ADPs shown in Fig. 9f indicate stronger lattice vibrational anharmonicity along the z-axis of the Cu and Sb atoms, which likely contributes to the increased phonon scattering rate. This suggests that the weak bonds between the Cu-Sb rings and Ba atoms can lead to significant interlayer lattice vibration, perhaps attributable to the relatively isolated state of Ba, effectively scattering phonons. Consequently, BaCuSb achieves a high phonon scattering rate with an average value of approximately 0.28 ps⁻1 (Fig. 9e), indicating a short phonon lifetime (τ).
Both the low vph and the short τ significantly reduce the mean free path (MFP) of phonons (l = vphτ), resulting in intrinsically low lattice thermal conductivity. According to the gas-dynamic thermal conductivity model (
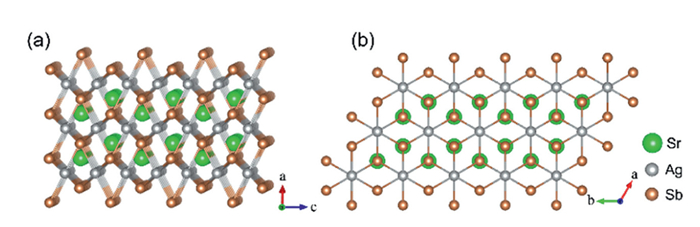
SrAgSb, which belongs to the space group of P63/mmc, shares structural similarities with BaCuSb. In this compound, the honeycomb Ag-Sb layer alternates with layers of alkaline-earth metal Sr (Fig. 10).
In 2020, Zhang et al. [102] analyzed the band structures and thermoelectric properties of XAgSb (where X = Sr, Eu). Notably, SrAgSb exhibited an anomalously low thermal conductivity of approximately 1.78 W m-1 K-1 at 300 K, which is significantly lower than that of the related compound BaAgSb, generating considerable interest in the thermoelectric community. In 2023, Yao et al. [126] revealed that the unusually low thermal conductivity of SrAgSb arises from an enhanced strength of anharmonicity compared to others.
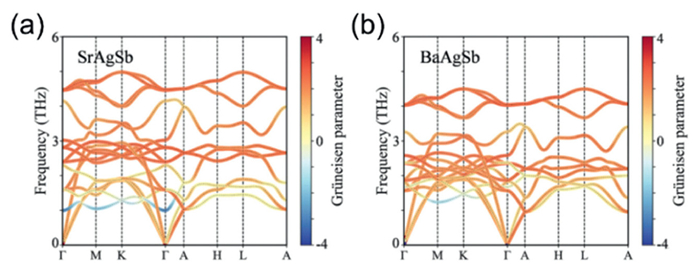
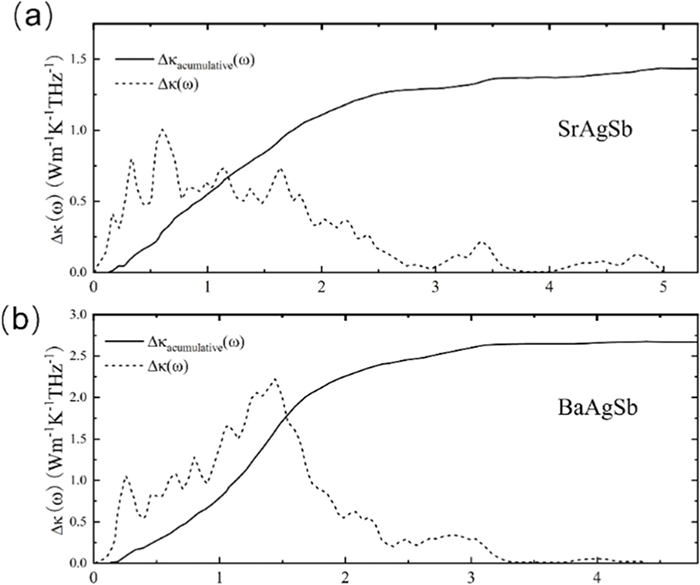
This is evidenced by the lowest-lying optical (LLO) branch exhibiting a negative and larger Grüneisen parameter [127], which is similar to the "ZO mode" in graphene (Fig. 11). By employing the ab initio phonon Boltzmann transport equation, the broader zone shows noticeably lower lattice thermal conductivity compared to other compounds indicates that the dominant contribution region to κL in SrAgSb is subject to stronger suppression from 0.4–2.7 THz, which ultimately leads to its low κL (Fig. 12).
This low κL can further be attributed to the unique phonons feature. The mode-dependent anharmonic scattering rate are plotted in Fig. 13. There are double prominent peaks in SrAgSb, different from BaAgSb, which could be further resolved into the emission and absorption process in 3-phonon scattering in Fig. 13c.
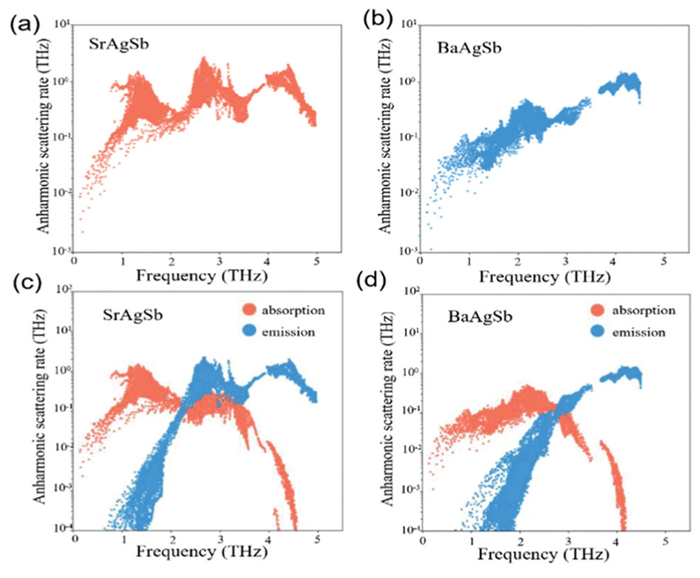
The absorption process is responsible for a large enhancement of the scattering rate around 1.3 THz, which stay inside the strongly inhibited region from 0.6–1.6 THz. Note that the front peak of scattering distribution is also consistent with the mean location of the soft and anharmonic LLO branch. Hence, the enhanced scattering rate of 3 phonons is from the absorption process around 1.3 THz, and the strong anharmonicity contributed to the low thermal conductivity of SrAgSb.
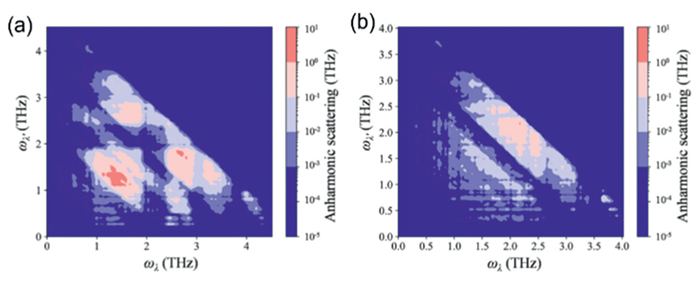
Fig. 14 presents the anharmonic scattering-rate contour of the absorption process correlated to two initial phonons with ωλ and ωλ′. A sparse q-mesh is utilized to simplify the Umklapp process, which primarily affects heat conduction. The peak values, indicated by the pink and red zones, as shown in Fig. 14a, suggest that the phonon with ωλ′ is likely to interact with the soft and anharmonic LLO branch corresponding to ωλ, and vice versa. Both interactions lead to a scattering-rate peak in the absorption process of SrAgSb. Although the optical phonon behaves flat and has a much slower group velocity, the anharmonic LLO branch can significantly scatter high group-velocity phonons in the range of 0.6–1.6 THz, contributing to the unusually low thermal conductivity.
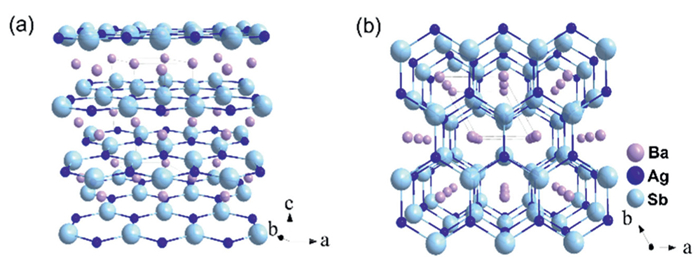
BaAgSb belongs to space group P63/mmc as shown in Fig. 15. Notice that the weak interlayer interactions between anionic [AgSb]2− layers and cationic Ba2+ layers have made BaAgSb behavior like a quasi-two-dimensional semiconductor, which showcases remarkable carrier mobility and outstanding thermoelectric performance. Zheng et al. carried out an in-depth exploration of the κL (approximately 0.4 W m-1 K-1 at 1012 K) by integrating computational and experimental studies [128]. The low thermal conductivity of BaAgSb primarily mainly stems from the intense anharmonic scattering induced by the relatively isolated Ba atoms and the small phonon group velocity owing to the weak Ag-Sb bonds.
As depicted in the phonon spectra of BaAgSb (Fig. 16), the cutoff frequencies of the three acoustic branches that significantly affect phonon transport are as low as 1.5 THz, highlighting the material's inherently low phonon group velocity. The calculated transverse modes (vt of TA1 and TA2) and longitudinal mode (vl of LA) are 1998 and 3730 m/s, respectively, which align closely with the experimental results (vt = 2080 m/s and vl = 3845 m/s).
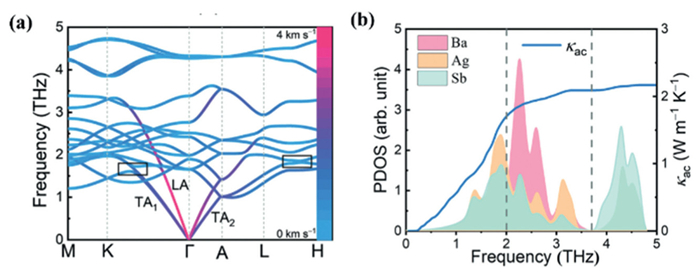
Additionally, low-frequency phonons, which dominate thermal transport in BaAgSb, are mainly associated with Ag and Sb atoms (Fig. 16b). This correlation links the material's small sound velocity to the weak covalent bonds between Ag and Sb atoms. Moreover, the low-frequency optical phonons, primarily arising from the vibrations of Ba atoms, exhibit a strong coupling with the acoustic branches, resulting in significant anharmonic scattering. This behavior underscores the rattling characteristics of the relatively isolated Ba atoms.
As illustrated in Fig. 16b, these phonons generate flat curves and do not contribute to heat conduction. Consequently, Ba atoms enhance anharmonic scattering, which suppresses thermal transport in the Ag-Sb layers, thus ensuring the inherently low lattice thermal conductivity of BaAgSb. The phonon scattering curvature plot reveals that the scattering rate of Umklapp processes is comparable to, or even exceeds, that of normal processes, confirming the strong lattice anharmonicity of BaAgSb (Fig. 17a).
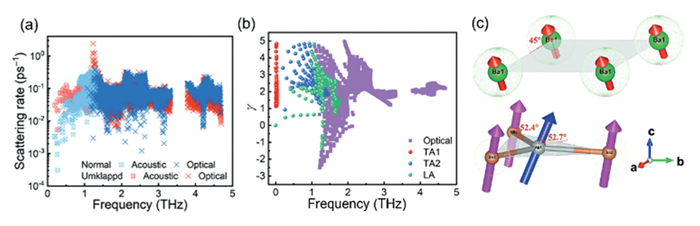
Notably, the normal scattering rate of acoustic phonons below 1 THz is significantly lower, while the anharmonic Umklapp processes still maintain a high scattering rate. Calculating the Grüneisen mode parameters at the corresponding frequencies (Fig. 17b) reveals that the highest γ among the three phonon modes can reach 5, with an average Grüneisen parameter (γave) of 2.2, providing direct evidence of strong lattice anharmonicity. Furthermore, the estimated γave for the TA1, TA2, and LA branches are 1.8, 2.3, and 2.0, respectively. The higher γave for TA2 and LA is attributed to their strong hybridization with the low-frequency optical phonons induced by Ba atom vibrations. ADPs further clarify this point. For Ag and Sb atoms, the ADP vector forms an angle of approximately 53° with the a-b plane, indicating stronger anharmonicity of lattice vibrations along the c-direction (Fig. 17c).
This phenomenon results from the weak interlayer interactions with Ba atoms, which act as rattling ions, exhibiting consistent vibration amplitudes in both in-plane and out-of-plane directions. This behavior triggers strong interlayer vibrational anharmonicity in the Ag-Sb layers, leading to a substantial phonon scattering rate.
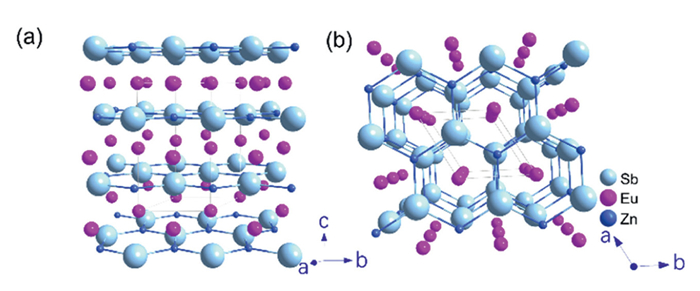
Zintl phase Eu2ZnSb2 [99,101] is based on the hexagonal crystal structure with space group of P63/mmc (Fig. 18), the same as EuAgSb. In the case of Eu2ZnSb2, there are 50% vacancies on the Zn site. This can be understood in terms of the Zintl concept as providing electronic charge balance as monovalent Ag+ is replaced by divalent Zn2+. In 2019, Chen et al. successfully prepared Eu2ZnSb2 samples and achieved a maximum zT value reaches ~1.0 at 823 K for Eu2Zn0.98Sb2 by further regulating the Zn deficiency. The following year, they enhanced the zT value of Eu2ZnSb2, by adjusting Zn content and the carrier concentration, result in a peak zT value of ~1.1 at 823 K for Eu2Zn0.95Ag0.06Sb2. As isomorphic compounds, the lattice thermal conductivity of Eu2ZnSb2 is significantly lower than that of EuAgSb. Compared to EuAgSb (Fig. 19a), this difference can be attributed to the larger scattering phase in Eu2ZnSb2 within the frequency range of approximately 0.8 THz to 3.5 THz (Fig. 19b).
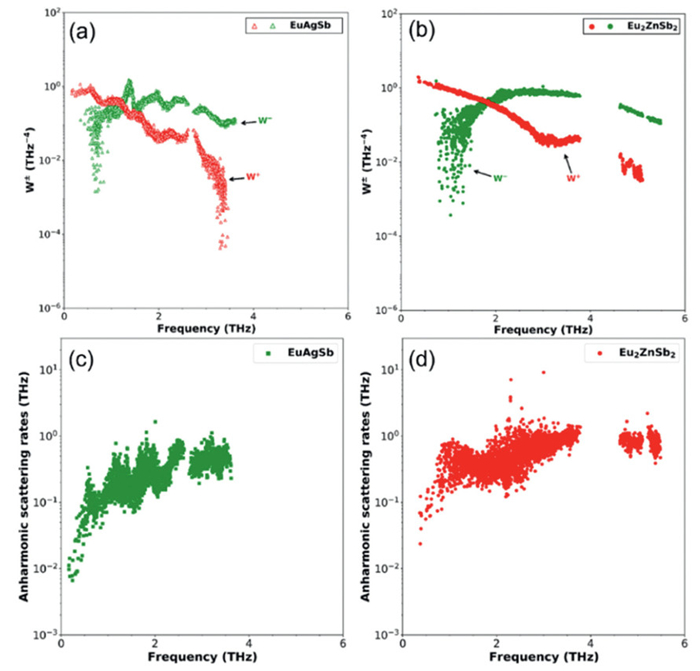
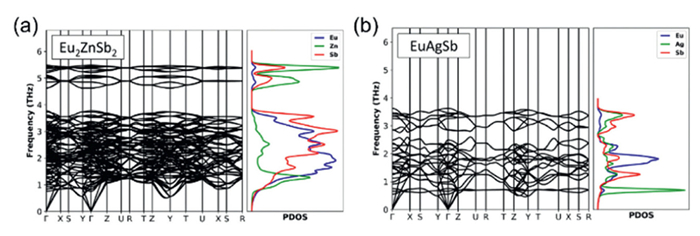
Additionally, the hybridization between the soft vibrations of Zn and the "host" lattice modes of Eu-Sb leads to higher anharmonic scattering rates compared to EuAgSb (Fig. 19c). This is evident in the two-peak structure observed below 2 THz in the phonon density of states (PDOS) related to Zn contributions, which features a sharp peak followed by a much broader peak at higher frequencies (Fig. 20), extending to approximately 3.5 THz (Fig. 19d). This behavior is reminiscent of filled skutterudites, where a similar two-peak feature is also observed in neutron scattering experiments. However, unlike the low lattice thermal conductivity mechanism at high temperatures, disorder at the Zn sites results in a constrained mean free path l, which is a key mechanism for thermal conductivity reduction at reduced temperatures. The Callaway model was applied to estimate the mean free path l with the longitudinal and two transverse acoustic modes being 3190 and 1900 m/s, respectively. For temperatures above room temperature, the lattice thermal conductivity κL can be expressed as κL = (CLvll + CTvtl)/3, where vl and vt are the longitudinal and transverse sound velocities, respectively. The specific heat capacities were approximated using the classical harmonic values of R per mole for each phonon branch (one longitudinal and two transverse branches), while the factor of 1/3 accounts for directional averaging. Based on this model, a mean free path (l) of approximately 150 Å was estimated to achieve a lattice thermal conductivity of κL = 0.4 W m-1 K-1.
This behavior, akin to that of artificial nanostructures, suppresses the phonon mean free path, resulting in a low κL of approximately 0.4 W m-1 K-1 in Eu2ZnSb2, even at elevated temperatures. Similarly, the isomorphic compound Sr2ZnSb2 [129,130], like Eu2ZnSb2, demonstrates tailored lattice anharmonicity due to intrinsic vacancies, combining the soft optical phonons and strong anharmonicity, has also achieved the κL of ~0.4 W m-1 K-1 from 300 K to 500 K. Both of them highlight the complex role of vacancies in these compounds. Therefore, exploring materials with unique properties is of considerable importance for advancing the thermoelectric field, underscoring the potential for novel material discoveries and enhancements in thermoelectric technology.
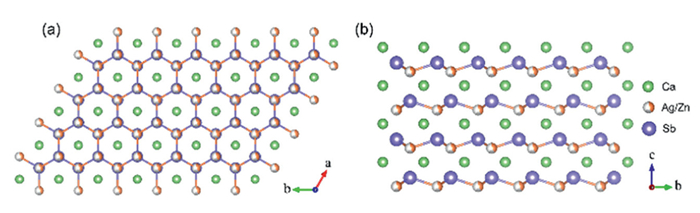
The LiGaGe-type Zintl phase thermoelectric materials in the CaZn1-xAg1-ySb series (0 < x < 1; 0 < y < 1) [104] can be formed through the transformation of CaAgSb. In 2018, Zhu et al. reported the successful strategy of replacing Ag with Zn, transitioning CaAgSb from a TiNiSi-type structure (Pnma) to a LiGaGe-type structure CaZn0.4Ag0.2Sb (P63mc) (Fig. 21). In CaZn0.4Ag0.2Sb, one Zn atom replaces two Ag atoms, leaving 40% of the sites originally occupied by Ag atoms vacant. This substitution and resulting vacancies aim to ensure a precise balance of electronic states within the Zintl phase.
In 2021, Chen et al. conducted a detailed study on the mechanisms behind the low thermal conductivity of CaZn0.4Ag0.2Sb [105], revealing a comprehensive structure for scattering phonons across a broad frequency range. In addition to point defects, this structure includes numerous CaAgSb nanoprecipitates, abundant edge dislocations around the precipitates, and twin boundaries (Fig. 22).
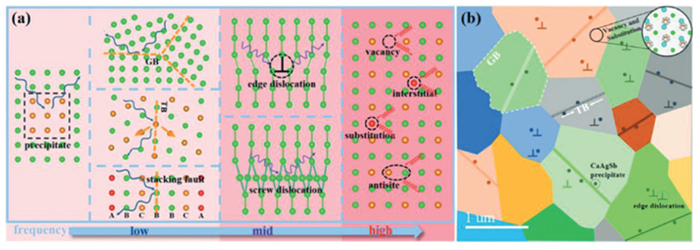
The disordered distribution of Zn/Ag defects leads to lattice distortions that effectively scatter high-frequency phonons, crucial for reducing the lattice thermal conductivity. Vacancies disrupt the phonon pathways, decreasing the mean free path and thus lowering thermal conductivity. Furthermore, grain boundaries and twin boundaries effectively scatter long-wavelength phonons, while nanoprecipitates and stress relief-induced dislocations also serve as phonon scattering centers. These structural characteristics collectively contribute to the lattice thermal conductivity (~0.5 W m−1 K−1) observed across the entire temperature range. Interestingly, the incorporation of trivalent rare earth elements (RE = La, Ce, Pr, Nd, or Sm) at the Ca site in CaAgSb can induce this structural transformation as well [122]. Moreover, compounds of Ca1-xCexAg1-xSb (x = 0.20, 0.40, 0.60) series has also demonstrated that structures with more defects and disorders tend to have lower lattice thermal conductivity κL, and the introduction of heavier Ce atoms will favor stronger phonon scattering as well. This phenomenon related to material structures symbolizes the flexibility in structural and performance tuning [121], underscoring the importance of researching and further exploring novel materials that involve structural transitions for the thermoelectric field.
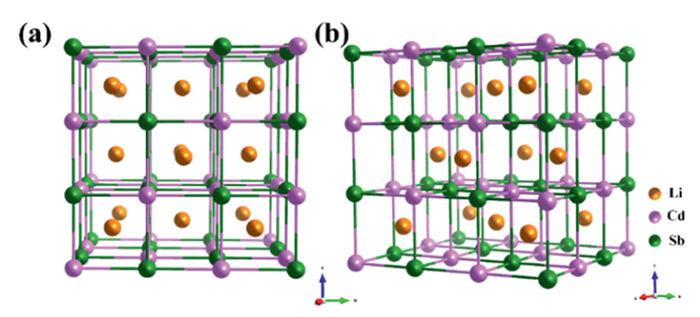
LiCdSb [131] features a high-symmetry crystal structure with the space group Fm3_m, which is isostructural to half-Heusler compounds like NbFeSb [132–134] and ZrNiSn [135,136], as illustrated in Fig. 23. Following the Zintl-Klemm rule, [CdSb4/4]- tetrahedrons function as Zintl anions while Li+ is regarded as Zintl cations. The high lattice symmetry ensures that LiCdSb exhibits a significantly large power factor compared to other Zintl phases. Moreover, within the context of the three acoustic branches primarily influenced by the vibration of Cd and Sb, the polyanionic framework also plays a crucial role in thermal transport. It has been noted that heavy atoms and weak interactions are advantageous for reducing lattice thermal conductivity in ABX materials. Theoretical calculations indicate that the integrated crystal orbital overlap population (ICOOP) value of Cd-Sb bonds is 0.05, indicating weak chemical bonding between Cd and Sb. Additionally, Li processes larger ADPs compared to Cd and Sb, displaying rattling-like scattering behavior (Fig. 24).
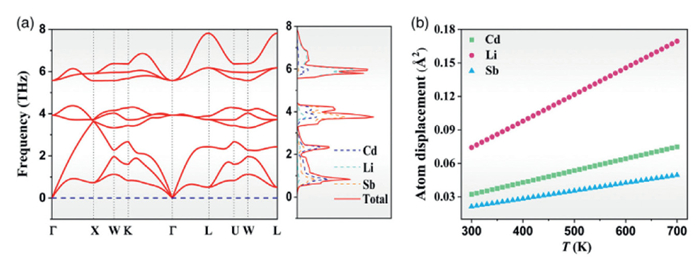
Consequently, the weak bonding within the polyanions, combined with the resonance vibration modes of Li+, contributes to the low lattice thermal conductivity of pure LiCdSb, as low as 3.2 W m-1 K-1 at 303 K and 0.85 W m-1 K-1 at 573 K. Ag doping can effectively enhance the electronic quality factor to improve the thermoelectric properties of LiCdSb. As a result, a peak zT of 0.79 at 633 K has been achieved, demonstrating the potential of the ternary compound LiCdSb as a promising thermoelectric parent material.
Very recently, Guo and co-works [134] reported the crystal structure and thermoelectric properties of Zintl phase KCdSb for the first time. Different from LiCdSb and NaCdSb, this compound adopts a tetragonal crystal structure with the space group of P4/nmm (Fig. 25). In this structure, [CdSb4/4]- tetrahedrons are connected by sharing corners and edges to form the Zintl anionic layers. Meanwhile, K+ ions are intercalated into the interlayered sites with the zigzag structure, which provide the electron to Zintl anionic layers for satisfying the charge balance.
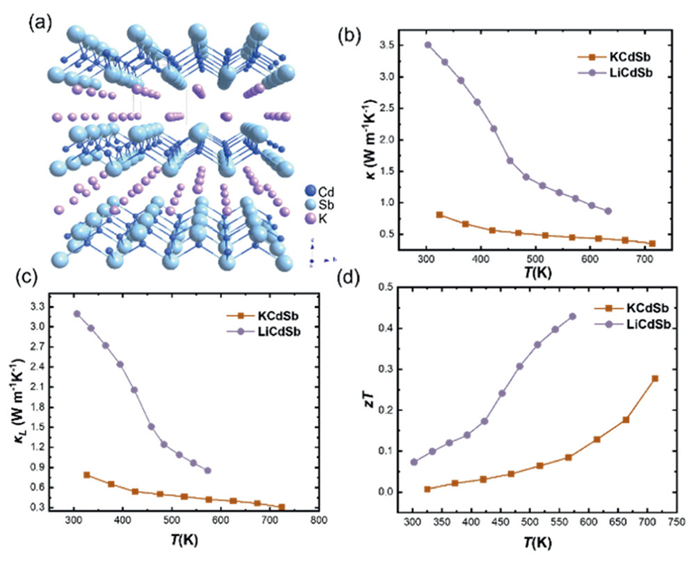
KCdSb shows the ultralow lattice thermal conductivity
In this review, we present a comprehensive summary and comparison of the thermoelectric performances of selected members of 1–1–1 type Zintl phase with ABSb classify, and provided detailed explanations of the mechanisms behind the low lattice thermal conductivity observed in various crystal structures. Specifically, the variable bond lengths in NaCdSb directly contribute to its ultralow lattice thermal. We also included the exploration of intrinsic vacancy ordering, local atomic vibrations, and full-scale defects in defective compounds such as Eu2ZnSb2 and CaZn0.4Ag0.2Sb. In addition, we examined several intricate mechanisms, such as heavier components, rattling behavior, weak interactions, which are primarily responsible for the suppressed lattice thermal conductivity in both TiNiSi-type and ZrBeSi-type compounds. While 1–1–1 series compounds generally exhibit promising thermoelectric performance, their practical application faces significant challenges due to inherent stability limitations, which impose stringent requirements on device operating conditions. Overcoming these limitations to enhance the applicability of 1–1–1 series compounds remains a substantial challenge in the field. A viable strategy involves property optimization through modification of relatively stable matrix materials emerges as a particularly crucial aspect. Notably, the κL modulation strategies summarized in this work extend beyond 1–1–1 series compounds, demonstrating broad applicability to various material systems. This universality significantly enhances the relevance of our findings for advancing materials with intrinsically low thermal conductivity, potentially impacting a wide range of thermoelectric applications.
The authors declare that they have no known competing financial interests or personal relationships that could have appeared to influence the work reported in this paper.
Yujie Huang: Writing – original draft, Validation, Investigation. Yuanxin Jiang: Validation, Investigation. Chen Chen: Writing – review & editing, Supervision. Shuankui Li: Visualization, Methodology. Kai Guo: Writing – review & editing, Supervision, Methodology, Conceptualization.
This work was financially supported by the National Natural Science Foundation of China (No. U21A2054), Key Discipline of Materials Science and Engineering, Bureau of Education of Guangzhou (No. 202255464), and "2 + 5″ Significant Academic Hubs and Platforms of Guangzhou University (Intelligent Manufacturing and Engineering, No. PT252022016).
F. Sun, H. Li, J. Tan, et al., J. Materiomics 10 (2024) 218–233. doi: 10.1016/j.jmat.2023.05.011
D. Li, Y. Gong, Y. Chen, et al., Nano-Micro Lett. 12 (2020) 36. doi: 10.1007/s40820-020-0374-x
H. Yao, Z. Fan, H. Cheng, et al., Macromol. Rapid Commun. 39 (2018) 1700727. doi: 10.1002/marc.201700727
Q. Zhang, Y. Sun, W. Xu, et al., Adv. Mater. 26 (2014) 6829–6851. doi: 10.1002/adma.201305371
W. Liu, J. Hu, S. Zhang, et al., Mater. Today Phys. 1 (2017) 50–60. doi: 10.1016/j.mtphys.2017.06.001
R. Kroon, D.A. Mengistie, D. Kiefer, et al., Chem. Soc. Rev. 45 (2016) 6147–6164. doi: 10.1039/C6CS00149A
Z. Wu, S. Zhang, Z. Liu, et al., Nano Energy 91 (2022) 106692. doi: 10.1016/j.nanoen.2021.106692
J. Wei, L. Yang, Z. Ma, et al., J. Mater. Sci. 55 (2020) 12642–12704. doi: 10.1007/s10853-020-04949-0
Q. Yan, M.G. Kanatzidis, Nat. Mater. 21 (2022) 503–513. doi: 10.1038/s41563-021-01109-w
J. He, T.M. Tritt, Science 357 (2017) eaak9997. doi: 10.1126/science.aak9997
G. Tan, M. Ohta, M.G. Kanatzidis, Philos. Trans. R. Soc. Math. Phys. Eng. Sci. 377 (2019) 20180450. doi: 10.1098/rsta.2018.0450
F. Tohidi, S. Ghazanfari Holagh, A. Chitsaz, Appl. Therm. Eng. 201 (2022) 117793. doi: 10.1016/j.applthermaleng.2021.117793
L. Yang, Z. Chen, M.S. Dargusch, et al., Adv. Energy Mater. 8 (2018) 1701797. doi: 10.1002/aenm.201701797
L. Zhang, X. Shi, Y. Yang, et al., Mater. Today 46 (2021) 62–108. doi: 10.1016/j.mattod.2021.02.016
A.R.M. Siddique, S. Mahmud, B.V. Heyst, Renew. Sustain. Energy Rev. 73 (2017) 730–744. doi: 10.1016/j.rser.2017.01.177
K. Chen, J. Pan, W. Yin, et al., Chin. Chem. Lett. 34 (2023) 108226. doi: 10.1016/j.cclet.2023.108226
M. Manno, P. Wang, A. Bar-Cohen, in: 13th Intersoc. Conf. Therm. Thermomechanical Phenom. Electron. Syst., San Diego, CA, USA, IEEE, 2012, pp. 413–420.
W. Chen, X. Shi, J. Zou, et al., Small Methods 6 (2022) 2101235. doi: 10.1002/smtd.202101235
W. Chen, X. Shi, J. Zou, et al., Mater. Sci. Eng. R: Rep. 151 (2022) 100700. doi: 10.1016/j.mser.2022.100700
D. Zhao, G. Tan, Appl. Therm. Eng. 66 (2014) 15–24. doi: 10.1016/j.applthermaleng.2014.01.074
J. Yan, X. Liao, D. Yan, et al., J. Microelectromechanical Syst. 27 (2018) 1–18.
Q. Zhang, J. Liao, Y. Tang, et al., Energy Environ. Sci. 10 (2017) 956–963. doi: 10.1039/C7EE00447H
E. Assareh, S.M. Alirahmi, P. Ahmadi, Geothermics 92 (2021) 102042. doi: 10.1016/j.geothermics.2021.102042
L. Zhao, C. Chang, G. Tan, et al., Energy Environ. Sci. 9 (2016) 3044–3060. doi: 10.1039/C6EE01755J
D. Qin, P. Yan, G. Ding, et al., Sci. Rep. 8 (2018) 2764. doi: 10.1038/s41598-018-20918-9
K. Radja, B.L. Farah, A. Ibrahim, et al., J. Phys. Chem. Solids 167 (2022) 110795. doi: 10.1016/j.jpcs.2022.110795
W. He, D. Wang, H. Wu, et al., Science 365 (2019) 1418–1424. doi: 10.1126/science.aax5123
J. Mao, H. Zhu, Z. Ding, et al., Science 365 (2019) 495–498. doi: 10.1126/science.aax7792
S. Roychowdhury, T. Ghosh, R. Arora, et al., Science 371 (2021) 722–727. doi: 10.1126/science.abb3517
J. Zhang, L. Song, S.H. Pedersen, et al., Nat. Commun. 8 (2017) 13901. doi: 10.1038/ncomms13901
L.D. Zhao, J. He, D. Berardan, et al., Energy Environ. Sci 7 (2014) 2900–2924. doi: 10.1039/C4EE00997E
S. Li, W. Zhao, X. Shi, et al., J. Mater. Sci. Technol. 214 (2025) 194–203. doi: 10.1016/j.jmst.2024.06.037
X. Yu, Z. Wang, P. Cai, et al., Inorg. Chem. 63 (2024) 20093. doi: 10.1021/acs.inorgchem.3c03955
M. Hamid Elsheikh, D.A. Shnawah, M.F.M. Sabri, et al., Renew. Sustain. Energy Rev. 30 (2014) 337–355. doi: 10.1016/j.rser.2013.10.027
Y. Liu, M. Zhou, J. He, Scr. Mater. 111 (2016) 39–43. doi: 10.1016/j.scriptamat.2015.06.031
L. Hu, T. Zhu, X. Liu, et al., Adv. Funct. Mater. 24 (2014) 5211–5218. doi: 10.1002/adfm.201400474
C. Zhao, Z. Li, T. Fan, et al., Research 2020 (2020) 9652749.
Y. Zheng, T.J. Slade, L. Hu, et al., Chem. Soc. Rev. 50 (2021) 9022–9054. doi: 10.1039/D1CS00347J
T. Wu, J. Kim, J.H. Lim, et al., Front. Chem. 9 (2021) 762896. doi: 10.3389/fchem.2021.762896
D. Bao, J. Chen, Y. Yu, et al., Chem. Eng. J. 388 (2020) 124295. doi: 10.1016/j.cej.2020.124295
C. Chang, L.D. Zhao, Mater. Today Phys. 4 (2018) 50–57.
M. Simoncelli, N. Marzari, F. Mauri, Nat. Phys. 15 (2019) 809–813. doi: 10.1038/s41567-019-0520-x
S. Fujii, M. Yoshiya, C.A.J. Fisher, Sci. Rep. 8 (2018) 11152. doi: 10.1038/s41598-018-29259-z
S. Lee, K. Esfarjani, T. Luo, et al., Nat. Commun. 5 (2014) 3525. doi: 10.1038/ncomms4525
Y. Zheng, T.J. Slade, L. Hu, et al., Chem. Soc. Rev. 50 (2021) 9022–9054. doi: 10.1039/D1CS00347J
Z. Chen, Z. Jian, W. Li, et al., Adv. Mater. 29 (2017) 1606768. doi: 10.1002/adma.201606768
Fitriani, R. Ovik, B.D. Long, et al., Renew. Sustain. Energy Rev. 64 (2016) 635–659. doi: 10.1016/j.rser.2016.06.035
A. Seko, A. Togo, H. Hayashi, et al., Phys. Rev. Lett. 115 (2015) 205901. doi: 10.1103/PhysRevLett.115.205901
S. Li, L. Wang, D. Ma, et al., ACS Appl Mater. Interfaces 16 (2024) 3586–3592. doi: 10.1021/acsami.3c17859
B. Zhu, X. Liu, Q. Wang, et al., Energy Environ. Sci. 13 (2020) 2106–2114. doi: 10.1039/d0ee01349h
S. Li, W. Zhao, Y. Cheng, et al., ACS Appl. Mater. Interfaces 15 (2023) 1167–1174. doi: 10.1021/acsami.2c18575
X. Lu, Q. Zheng, S. Gu, et al., Chin. Chem. Lett. 31 (2020) 880–884. doi: 10.1016/j.cclet.2019.07.034
H.J. Wu, L.D. Zhao, F.S. Zheng, et al., Nat. Commun. 5 (2014) 4515. doi: 10.1038/ncomms5515
B. Jia, Y. Huang, Y. Zhou, et al., Environ. Sci. 15 (2022) 1920. doi: 10.1039/d1ee03883d
B. Jiang, W. Wang, S. Liu, et al., Science 377 (2022) 208–213. doi: 10.1126/science.abq5815
W. Liu, D. Wang, Q. Liu, et al., Adv Energy Mater. 10 (2020) 2000367. doi: 10.1002/aenm.202000367
Chemical Rubber CompanyCRC Handbook of Thermoelectrics, CRC Press, Boca Raton, Fla, 1995.
M. Rull. Bravo, A. Moure, J.F. Fernández, et al., RSC Adv. 5 (2015) 41653. doi: 10.1039/C5RA03942H
G.S. Nolas, D.T. Morelli, T.M. Tritt, Annu. Rev. Mater. Sci. 29 (1999) 89–116. doi: 10.1146/annurev.matsci.29.1.89
T. Takabatake, K. Suekuni, T. Nakayama, et al., Rev. Mod. Phys. 86 (2014) 669–716. doi: 10.1103/RevModPhys.86.669
J. Yang, L. Xi, W. Qiu, et al., Npj Comput. Mater. 2 (2016) 15015. doi: 10.1038/npjcompumats.2015.15
K. Peng, X. Lu, H. Zhan, et al., Energy Environ. Sci. 9 (2016) 454–460. doi: 10.1039/C5EE03366G
L. Zhao, S.H. Lo, Y. Zhang, et al., Nature 508 (2014) 373. doi: 10.1038/nature13184
P. Li, X. Ai, Q. Zhang, et al., Chin. Chem. Lett. 32 (2021) 811–815. doi: 10.1016/j.cclet.2020.04.046
C. Zhou, Y.K. Lee, Y. Yu, et al., Nat. Mater. 20 (2021) 1378–1384. doi: 10.1038/s41563-021-01064-6
S.M. Kauzlarich, Comment. Inorg. Chem. 10 (1990) 75–88. doi: 10.1080/02603599008050859
H. Schafer, Annu. Rev. Mater. Res. 15 (1985) 1–42. doi: 10.1146/annurev.ms.15.080185.000245
R. Nesper, Z. Für Anorg. Allg. Chem. 640 (2014) 2639–2648. doi: 10.1002/zaac.201400403
S.M. Kauzlarich, Chem. Mater. 35 (2023) 7355–7362. doi: 10.1021/acs.chemmater.3c01874
F. Gascoin, S. Ottensmann, D. Stark, Adv. Funct. Mater. 15 (2005) 1860–1864. doi: 10.1002/adfm.200500043
A.P. Justl, F. Ricci, A. Pike, et al., Sci. Adv. 8 (2022) eabq3780. doi: 10.1126/sciadv.abq3780
S.K. Bux, A. Zevalkink, O. Janka, et al., J. Mater. Chem. A 2 (2014) 215–220. doi: 10.1039/C3TA14021K
J. Feng, W. Wang, S. Huang, et al., ACS Appl. Energy Mater. 4 (2021) 913–920. doi: 10.1021/acsaem.0c02825
Y. Hu, J. Wang, A. Kawamura, et al., Chem. Mater. 27 (2015) 343–351. doi: 10.1021/cm504059t
S. Ohno, U. Aydemir, M. Amsler, et al., Adv. Funct. Mater. 27 (2017) 1606361. doi: 10.1002/adfm.201606361
B.R. Ortiz, P. Gorai, L. Krishna, et al., J. Mater. Chem. A 5 (2017) 4036–4046. doi: 10.1039/C6TA09532A
B.R. Ortiz, P. Gorai, V. Stevanović, et al., Chem. Mater. 29 (2017) 4523–4534. doi: 10.1021/acs.chemmater.7b01217
J. Shuai, H. Geng, Y. Lan, et al., Proc. Natl. Acad. Sci. U. S. A. 113 (2016) E4125–E4132.
J. Shuai, Z. Liu, H.S. Kim, et al., J. Mater. Chem. A 4 (2016) 4312–4320. doi: 10.1039/C6TA00507A
H. Tamaki, H.K. Sato, T. Kanno, Adv. Mater. 28 (2016) 10182–10187. doi: 10.1002/adma.201603955
E.S. Toberer, S.R. Brown, T. Ikeda, et al., Appl. Phys. Lett. 93 (2008) 062110. doi: 10.1063/1.2970089
E.S. Toberer, C.A. Cox, S.R. Brown, et al., Adv. Funct. Mater. 18 (2008) 2795–2800. doi: 10.1002/adfm.200800298
A. Zevalkink, E.S. Toberer, W.G. Zeier, et al., Energy Env. Sci 4 (2011) 510–518. doi: 10.1039/C0EE00517G
A. Zevalkink, W.G. Zeier, E. Cheng, et al., Chem. Mater. 26 (2014) 5710–5717. doi: 10.1021/cm502588r
A. Zevalkink, W.G. Zeier, G. Pomrehn, et al., Energy Environ. Sci. 5 (2012) 9121. doi: 10.1039/c2ee22378c
J. Zhang, Q. Liu, K.-F. Liu, et al., Inorg. Chem. 60 (2021) 4026–4033. doi: 10.1021/acs.inorgchem.1c00078
L. Zheng, W. Li, X. Wang, et al., J. Mater. Chem. A 7 (2019) 12773–12778. doi: 10.1039/c9ta03502h
T. Zhou, J. Song, X. Lei, et al., Acta Mater. 223 (2022) 117467. doi: 10.1016/j.actamat.2021.117467
K. Guo, T. Weng, Y. Jiang, et al., Mater. Today Phys. 21 (2021) 100480. doi: 10.1016/j.mtphys.2021.100480
C. Chen, W. Xue, S. Li, et al., Proc. Natl. Acad. Sci. U. S. A. 116 (2019) 2831–2836. doi: 10.1073/pnas.1819157116
Z. Zhang, Y. Yan, X. Li, et al., Adv. Energy Mater. 10 (2020) 2001229. doi: 10.1002/aenm.202001229
Q. Cao, J. Zheng, K. Zhang, et al., J. Alloys Compd. 680 (2016) 278–282. doi: 10.1016/j.jallcom.2016.04.118
C. Yang, K. Guo, X. Yang, et al., ACS Appl. Energy Mater. 2 (2019) 889–895. doi: 10.1021/acsaem.8b01977
K. Guo, J. Lin, Y. Li, et al., J. Mater. Chem. A 8 (2020) 5323–5331. doi: 10.1039/d0ta00245c
D.M. Young, C.C. Torardi, M.M. Olmstead, et al., Chem. Mater. 7 (1995) 93–101. doi: 10.1021/cm00049a015
A. Rehr, T.Y. Kuromoto, S.M. Kauzlarich, et al., Chem. Mater. 6 (1994) 93–99. doi: 10.1021/cm00037a020
T.Y. Kuromoto, S.M. Kauzlarich, D.J. Webb, Chem. Mater. 4 (1992) 435–440. doi: 10.1021/cm00020a036
J.Y. Chan, M.M. Olmstead, S.M. Kauzlarich, et al., Chem. Mater. 10 (1998) 3583–3588. doi: 10.1021/cm980358i
C. Chen, W. Xue, S. Li, et al., Proc. Natl. Acad. Sci. U. S. A. 116 (2019) 2831–2836. doi: 10.1073/pnas.1819157116
C. Chen, X. Li, W. Xue, et al., Nano Energy 73 (2020) 104771. doi: 10.1016/j.nanoen.2020.104771
C. Chen, Z. Feng, H. Yao, et al., Nat. Commun. 12 (2021) 5718. doi: 10.1038/s41467-021-25483-w
W. Zhang, C. Chen, H. Yao, et al., Chem. Mater. 32 (2020) 6983–6989. doi: 10.1021/acs.chemmater.0c02317
K. Guo, Y. Zhang, S. Yuan, et al., Angew. Chem. Int. Ed. 62 (2023) e202212515. doi: 10.1002/anie.202212515
M. Zhu, Z. Wu, Q. Liu, et al., J. Mater. Chem. A 6 (2018) 11773–11782. doi: 10.1039/c8ta04001j
J. Chen, W. Xue, C. Chen, et al., Adv. Sci. 8 (2021) 2100109. doi: 10.1002/advs.202100109
A.K.M.A. Shawon, W. Guetari, K. Ciesielski, et al., Chem. Mater. 36 (2024) 1908–1918. doi: 10.1021/acs.chemmater.3c02621
Q. Liu, K. Liu, Q. Wang, et al., Acta Mater. 230 (2022) 117853. doi: 10.1016/j.actamat.2022.117853
S. Zheng, K. Peng, S. Xiao, et al., J. Adv. Ceram. 11 (2022) 1604–1612. doi: 10.1007/s40145-022-0634-y
G. Savelsberg, H. Schäfer, Z. Für Naturforschung B 33b (1978) 370–373. doi: 10.1515/znb-1978-0404
K. Liu, C. Chen, J. Cheng, et al., Adv. Funct. Mater. 35 (2025) 2419145. doi: 10.1002/adfm.202419145
M.C. Schäfer, N.T. Suen, S. Bobev, Dalton Trans. 43 (2014) 16889–16901. doi: 10.1039/C4DT02220C
B.C. Sales, B.C. Chakoumakos, D. Mandrus, et al., J. Solid State Chem. 146 (1999) 528–532. doi: 10.1006/jssc.1999.8354
D. Huo, T. Sakata, T. Sasakawa, et al., Phys. Rev. B 71 (2005) 075113. doi: 10.1103/PhysRevB.71.075113
J. Mi, M. Christensen, E. Nishibori, et al., Phys. Rev. B 84 (2011) 064114. doi: 10.1103/PhysRevB.84.064114
H. Lin, G. Tan, J. Shen, et al., Angew. Chem. 128 (2016) 11603–11608. doi: 10.1002/ange.201605015
A. Bhui, M. Dutta, M. Mukherjee, et al., Chem. Mater. 33 (2021) 2993–3001. doi: 10.1021/acs.chemmater.1c00659
G. Tan, S. Hao, J. Zhao, et al., J. Am. Chem. Soc. 139 (2017) 6467–6473. doi: 10.1021/jacs.7b02399
S. Gupta, A.K. Ganguli, J. Solid State Chem. 179 (2006) 1318–1322. doi: 10.1016/j.jssc.2006.01.059
N. Miyazaki, N. Adachi, Y. Todaka, et al., J. Alloys Compd. 691 (2017) 914–918. doi: 10.1016/j.jallcom.2016.08.227
Y. Huang, H. Nagai, K. Hayashi, et al., J. Alloys Compd. 771 (2019) 111–116. doi: 10.17951/ijsr.2018.7.0.111-121
X. Li, M. Zhu, Z. Wu, et al., Chem. Mater. 29 (2017) 3324–3333. doi: 10.1021/acs.chemmater.7b00716
J. Wang, X.C. Liu, S.Q. Xia, et al., J. Am. Chem. Soc. 135 (2013) 11840–11848. doi: 10.1021/ja403653m
A.K.M.A. Shawon, W. Guetari, K. Ciesielski, et al., Chem. Mater. 36 (2024) 1908–1918. doi: 10.1021/acs.chemmater.3c02621
P. Ying, X. Li, Y. Wang, et al., Adv. Funct. Mater. 27 (2017) 1604145. doi: 10.1002/adfm.201604145
D.K. Wilson, B. Saparov, S. Bobev, Z. Für Anorg. Allg. Chem. 637 (2011) 2018–2025. doi: 10.1002/zaac.201100177
H. Yao, C. Chen, F. Cao, et al., Phys. Rev. B 108 (2023) 195206. doi: 10.1103/PhysRevB.108.195206
Q. Gao, Y. Jiao, A. Sanson, et al., Chin. Chem. Lett. 34 (2023) 107564. doi: 10.1016/j.cclet.2022.05.078
S. Zheng, S. Xiao, K. Peng, et al., Adv. Mater. 35 (2023) 2210380. doi: 10.1002/adma.202210380
J. Zhu, Q. Ren, C. Chen, et al., Nat. Commun. 15 (2024) 2618. doi: 10.1038/s41467-024-46895-4
C. Wang, Q. Wang, Q. Zhang, et al., Chem. Mater. 34 (2022) 7837–7844. doi: 10.1021/acs.chemmater.2c01430
X. Yang, S. Yuan, K. Guo, et al., Small Sci. 2 (2022) 2200065. doi: 10.1002/smsc.202200065
G. Joshi, R. He, M. Engber, et al., Energy Environ. Sci. 7 (2014) 4070–4076. doi: 10.1039/C4EE02180K
J. Yu, C. Fu, Y. Liu, et al., Adv. Energy Mater. 8 (2018) 1701313. doi: 10.1002/aenm.201701313
K. Guo, J. Zhang, X. Yu, et al., Adv. Sci. 11 (2024) 2402209. doi: 10.1002/advs.202402209
H. Xie, H. Wang, Y. Pei, et al., Adv. Funct. Mater. 23 (2013) 5123–5130. doi: 10.1002/adfm.201300663
T. Zhu, C. Fu, H. Xie, et al., Adv. Energy Mater. 5 (2015) 1500588. doi: 10.1002/aenm.201500588


Figure 3 The crystal structure of NaCdSb. (a) The view along b-axis. (b) Cd-Sb irregular tetrahedron along a-axis.

Figure 4 The crystal structure of CaLiSb. (a) The view along a-axis. (b) Li-Sb tetrahedron illustrative diagram.

Figure 5 View of CaLiSb, and Li atoms are located in the distorted tetrahedral formed by Sb atoms. Reproduced with permission [107]. Copyright 2022, Elsevier.

Figure 6 (a) Temperature dependence of the ADP values for CaLiSb single crystal. (b) Lattice thermal conductivity κL as a function of temperature for CaLiSb. The brown line represents the function of κL-T−1. Reproduced with permission [107]. Copyright 2022, Elsevier.

Figure 7 The crystal structure: (a) The view along a-axis. (b) The view along b-axis of CaAgSb.

Figure 8 The crystal structure of BaCuSb. (a) The view of intralayer direction. (b) The view of interlayer direction.

Figure 9 (a) Total thermal conductivity. (b) Lattice thermal conductivity. (c) zT values of XCuSb. (d) Phonon dispersions. (e) Scattering rates. (f) ADPs for BaCuSb. Reproduced with permission [108]. Copyright 2022, Springer Nature.

Figure 10 The crystal structure of SrAgSb. (a) The view along b-axis. (b) The view along c-axis.

Figure 11 Calculated phonon spectra of (a) SrAgSb, (b) BaAgSb. Reproduced with permission [126]. Copyright 2023, American Physical Society.

Figure 12 The frequency cumulative (solid line) and derivative (dashed line) lattice thermal conductivity from PBTE results. (a) SrAgSb, (b) BaAgSb. Reproduced with permission [126]. Copyright 2023, American Physical Society.

Figure 13 Mode-dependent anharmonic scattering rate (τω(q, j)) for (a) SrAgSb, (b) BaAgSb. The comparison of scattering rate under dense and sparse q-grid between (c) SrAgSb, (d) BaAgSb. Reproduced with permission [126]. Copyright 2023, American Physical Society.

Figure 14 Mode-dependent anharmonic scattering rate (τω(q, j)) for (a) SrAgSb, (b) BaAgSb in Umklapp and absorption process. Reproduced with permission [126]. Copyright 2023, American Physical Society.

Figure 15 The crystal structure of BaAgSb. (a) The view of intralayer direction. (b) The view of interlayer direction.

Figure 16 (a) Calculated phonon dispersions projected by sound velocity. (b) Partial phonon density of states (PDOS) and accumulative lattice thermal conductivity as a function of frequency for BaAgSb. Reproduced with permission [128]. Copyright 2023, Wiley

Figure 17 (a) Frequency dependent pH–pH scattering rate at 300 K. (b) Calculated mode Grüneisen parameters of BaAgSb at 300 K. (c) Room-temperature atomic displacement parameters. Reproduced with permission [128]. Copyright 2023, Wiley.

Figure 18 The crystal structure of Eu2ZnSb2. (a) The view of intralayer direction. (b) The view of Interlayer direction.

Figure 19 Scattering phase space and scattering rates as a function of phonon frequency. This is the phase space for different phonon modes of (a) zig-zag structure EuAgSb and (b) Eu2ZnSb2. The + (-) sign represents three-phonon absorption (emission) phase space. The calculated anharmonic scattering rates for (c) EuAgSb and (d) Eu2ZnSb2. Reproduced with permission [101]. Copyright 2021, Springer Nature.

Figure 20 Calculated phonon dispersion relations and phonon density of states for (a) Eu2ZnSb2 (zig-zag structure) and (b) EuAgSb. Reproduced with permission [101]. Copyright 2025, Springer Nature.

Figure 21 Atomic structure model of CaAg0.2Zn0.4Sb: (a) The view of structure along c-axis. (b) Structure along a-axis.

Figure 22 Illustration of (a) defects frequently occurring in thermoelectric materials. (b) Schematic view of microstructure in CaAg0.2Zn0.4Sb. Reproduced with permission [105]. Copyright 2021, Wiley.

Figure 23 The crystal structure of LiCdSb. (a) The view along planar direction. (b) The view along diagonal direction.

Figure 24 (a) The phono dispersion of LiCdSb. (b) The atom displacement of LiCdSb. Reproduced with permission [131]. Copyright 2025, Wiley.

Figure 25 (a) The crystal structure of KCdSb with space group P4/nmm. (b) Thermal conductivity. (c) Lattice thermal conductivity. (d) zT value of KCdSb and LiCdSb.
Table 1. The research sequence of partial typical compounds.
| Year | 2018 | 2019 | 2020 | 2021 | 2022 | 2023 | 2024 |
| P63/mmc | Eu2ZnSb2 | SrAgSb | BaAgSb | BaCuSb | |||
| P63mc | CaZn0.4Ag0.18Sb | ||||||
| Pnma | SrLiSb | NaCdSb | |||||
| P4/nmm | KCdSb | ||||||
| Fm-3m | LiCdSb |
 下载: 导出CSV
Table 2. Current research on ZrBeSi-type ABSb compounds.
| Empty Cell | Ca | Sr | Ba | Eu |
| Cu | CaCuSb | SrCuSb | BaCuSb | EuCuSb |
| Ag | SrAgSb | BaAgSb | EuAgSb | |
| Au | SrAuSb* | BaAuSb* | EuAuSb* | |
| * indicates that the thermoelectric properties of this compound have not been studied. | ||||
下载: 导出CSV

 扫一扫看文章


扫一扫关注我们

 下载:
下载: