Key Laboratory of Bioinorganic and Synthetic Chemistry of Ministry of Education, School of Chemistry, Institute of Green Chemistry and Molecular Engineering, Guangdong Basic Research Center of Excellence for Functional Molecular Engineering, Sun Yat-sen University, Guangzhou 510006, China
Received Date:
17 February 2025 Accepted Date:
03 April 2025 Revised Date:
28 March 2025 Available Online:
15 August 2026
Abstract:
The under-barrier Raman relaxation process has long presented a formidable challenge in advancing the performance of single-molecule magnets (SMMs). Exploring the nuanced differences in Raman relaxation processes between two structurally analogous systems remains relatively uncharted territory. Herein, two Dy(Ⅲ)-based single-ion magnets (SIMs) with pentagonal bipyramidal geometry were reported, and their Raman relaxation behaviors were regulated by precisely adjusting the protonation level of the bis-hydrazone moiety. Intriguingly, under the optimal magnetic field, the degree of protonation shows no impact on the Raman exponent n but causes a distinct variation in the Raman relaxation coefficient C. The effects of deprotonation on the molecular geometry and charge distribution were elucidated through ab initio and electrostatic potential (ESP) calculations. Deprotonation results in an asymmetric charge distribution within the equatorial plane, causing the coefficient C to increase substantially by 3.5 times, aligning closely with the theoretical calculation value of approximately 2.8 times. This study provides concise and effective molecular archetypes for investigating the Raman relaxation process.
Single-molecule magnets manifest magnetic bistability and slow magnetic relaxation at the molecular scale, underscoring their potential in ultrahigh-density information storage, quantum computation, and molecular spintronics [1–3]. Dysprosium(Ⅲ) ions are often used as spin carrier to construct high-performance SIMs [4–8]. However, the presence of quantum tunneling of magnetization (QTM) and Raman process always cut down the blocking temperature (TB) and reversal barrier (Ueff), limiting their practical applications [9–12].
For most Dy(Ⅲ)-based SIMs, the mechanisms of magnetic moment reversal include spin-lattice relaxations (Orbach, Raman and direct process) and QTM [13–15]. Both Orbach and Raman processes are two-phonon processes, with the former possessing a real energy barrier. The spin-lattice Raman process is a type of under-barrier process and typically dominates the slow magnetic relaxation of SIMs at high temperatures [16–20]. Van Vleck initially identified the dependence of this process by considering the modulation of crystal field (CF) [21]. With the continuous deepening of theoretical research, the origins of various anomalous exponents n and coefficients C observed in Raman process during experiments have gradually been elucidated [13,22–23]. Lunghi et al. computed relaxation times fully ab initio in prototypical SMMs like [Dy(acac)3(H2O)2] and contributed it to the low-energy phonons [18,24,25]. Gu et al. explained the under-barrier Raman relaxation by the vibronic barrier and suggested the low Raman exponent n to the optical phonons [26,27]. On this basis, Zheng et al. correlated the under-barrier Raman relaxation of DyⅢ-based SIMs directly to ligand vibrational modes using terahertz and far-infrared spectroscopy [28].
The protonation of ligands can directly regulate the charge carried by the complex and affect their magnetic and optical properties [29–31]. The calculation of continuous shape measures (CShM) [32,33] and the visualization of ESP [34] provide a clear way to explore the changes in coordination spheres induced by protonation. Different degree of protonation can alter molecular vibrations and intramolecular hydrogen bonding interactions, leading to distinct spin-phonon coupling in the Raman process [35–38]. Additionally, protons are essential for intermolecular hydrogen bonding during molecular aggregation, influencing the slow magnetic relaxation behavior that arises from the intrinsic magnetic dipole field [39,40].
The proton-controlled magnetic relaxation of double-decker SMMs constructed from porphyrin/indole-based ligands has been previously reported. In 2012, Ogawa et al. reported the first tetraphenylporphyrin based double-decker complexes with determined protonated and deprotonated crystal structures, and their switchable magnetic relaxation by a single proton [41,42]. Yamashita et al. employed 1H NMR spectroscopy to demonstrated that altering the protonation degree of indolenine-substituted annulene ligands is an effective way to tune the magnetic properties [43]. The pentadentate bis-hydrazone ligands are a very common class of macrocyclic ligands with high rigidity and huge conjugation [35,36,44,45]. Previous studies have reported that the hydrazine unit in bis-hydrazone ligands (H2−xL)x− (x = 0, 1, 2) can possess various degree of protonation in transition-metal complexes, which can be determined through geometrical parameters [10]. However, altering the degree of protonation of the ligand preserving a highly similar structure and ensuring the performance of SMMs remain challenging. As a result, a comprehensive understanding of the correlation between complexes in different protonated states and their magnetic relaxation behavior, particularly through crystallographic analysis, remains limited.
Herein, we report two Dy(Ⅲ) SIMs with pentagonal-bipyramidal (PBP) geometry, [Dy(HDAPP)(MeDDTP)2]·EtOH (1) and [Dy(H2DAPP)(MeDDTP)2](BPh4)·2EtOH·H2O (2), where HMeDDTP = 4-methyl-2,6-di(1,3-dithiolan-2-yl)phenol) and H2DAPP = (2,6-diacetylpyridine)-bis(2-pyridyl-hydrazone). The protonation degree of H2DAPP ligand was controlled by using different equivalents of base. Magnetic measurements show typical SMM behaviors for both complexes. However, only Raman coefficient C changes before and after deprotonation, and the Raman exponent n remains unchanged. Upon proton removal, the charge distribution of N atoms coordinated to Dy(Ⅲ) in the equatorial plane becomes less uniform, resulting in stronger transverse crystal fields and larger off-diagonal matrix elements, which in turn increase the Raman coefficient C. With the assistance of ab initio calculations and ESP, a deeper investigation into magneto-structure correlations was conducted.
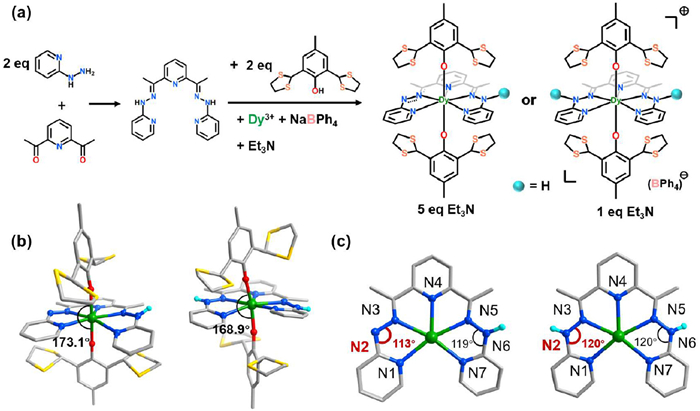
The planar ligand H2DAPP was synthesized by carbonyl-amine condensation between 2,6-diacetyl pyridine and 2-hydrazineylpyridine [46], and the axial ligand HMeDDTP was synthesized by thioacetal reaction between 4-methyl-2,6-di-formylphenol and 1,2-ethanedithiol [39]. Air stable complexes 1 and 2 were synthesized by reacting Dy(OTf)3, H2DAPP and HMeDDTP via solvothermal method with varying amounts of triethylamine (Et3N) (Fig. 1a). Related crystallographic parameters and refinement data are listed in Table S1 (Supporting information). The purity of the samples was verified by powder X-ray diffraction (PXRD) in Fig. S2 (Supporting information). Infrared spectroscopy (IR) analysis was performed on complexes 1 and 2 at room temperature. As depicted in Fig. S3 (Supporting information), the asymmetric stretching vibrations of methylene group of axial ligands (MeDDTP−) occur around 2962 and 2920 cm–1, and the stretching vibration of C−S bonds appears near 634 cm–1 [47]. Both complexes exhibit stretching vibrations of imine groups (N=C) from planar pockets around 1614 cm–1, with similar transmittances. However, since complex 2 did not undergo deprotonation, the vibrations of N−H groups will be significantly stronger than in 1. The transmittances corresponding to the non-planar rocking vibration of the N −H in the secondary amine in 2 (737 cm–1 and 708 cm–1) are relatively stronger than those in 1 (733 cm–1 and 692 cm–1). Additionally, the stretching vibration of N−H is also more clearly observed at 3336 cm–1 in complex 2.
Figure 1
Figure 1.
(a) Reaction scheme for the synthesis of 1 and 2. (b) Molecular structures from single-crystal X-ray diffraction of 1 (left) and 2 (right). (c) The planar coordination environments around Dy(Ⅲ) of 1 (left) and 2 (right). Color codes: Dy, green; O, red; N, blue; S, yellow; C, gray; H, sky blue. Partial hydrogen atoms, solvent molecules, and disordered components are omitted for clarity.
Single-crystal X-ray diffraction (SCXRD) analysis reveals that complex 1 crystallizes in the monoclinic space group P21/c, while complex 2 crystallizes in the trigonal space group R−3. The molecular skeletons for both complexes are highly similar, with the primary difference being the protonated degree of the H₂DAPP ligands. The precise deprotonation position (N2) of bis-hydrazone moiety was determined by the two-dimensional Fourier difference electron density maps (FMAPs) derived from SCXRD data (Fig. S4 in Supporting information) [48], along with bond angles and intermolecular hydrogen bonding (see below) [10].
The Dy(Ⅲ) sites in both complexes possess a distorted pentagonal bipyramidal coordination sphere, encapsulated by the N5 pocket and axially coordinated by two phenoxide atoms. The coordination geometry is further confirmed by the CShM with the smallest deviation of pentagonal bipyramid (pseudo-D5h symmetry) compared with other geometries (Table S2 in Supporting information). For complex 1, the addition of excessive base (5 equiv.) leads to a deprotonation of bis-hydrazone ligand. The N−N−C angles and the FMAPs confirmed the protonated state: the FMAPs from crystallographic data indicate only the proton of N2 is removed [48]; the angle N3−N2−C18 centered with N2 is smaller than the angle of N5−N6−C28 (Fig. 1c), which is in line with the trend observed in transition-metal complexes [10].
In contrast, complex 2 with less base (1 equiv.) maintains the protonation of the H2DAPP ligand. Attempts to use stronger or excess bases to achieve full deprotonation of the complex were unsuccessful, likely due to the robust intermolecular interactions in the half-deprotonated HDAPP− ligand (see below). For the first coordination sphere, the average equatorial Dy–N bond lengths of N5 pockets are similar, with values of 2.488(8) Å for 1 and 2.482(4) Å for 2. However, compared to 2, complex 1 exhibits a longer average axial Dy–O bond length (2.170(6) vs. 2.124(4) Å) but a more linear O−Dy−O angle (173.1(3) vs. 168.89(17)°) (Fig. 1b).
The protonation degree of the bis-hydrazone moiety plays a key role in determining the molecular stacking. For 1, the partially deprotonated HDAPP− ligand gives neutral [Dy(HDAPP)(MeDDTP)2] molecules. These molecules form a robust one-dimensional zigzag supramolecular chain by N−H···O and O−H···N hydrogen bonds between ethanol and HDAPP− ligands (Fig. S9 in Supporting information). In contrast, the supramolecular stacking of 2 is driven by π-π interactions between the closest Dy centers, while N−H···O and C/O−H···π interactions between ethanol, BPh4−, and HDAPP− form a hexagonal supramolecular grid (Fig. S10 in Supporting information). This arrangement results in complex 2 crystallizing in the trigonal crystal system, with a crystallographic C3 axis passing through a one-dimensional channel (Fig. S8 in Supporting information). In the Hirshfeld 2D fingerprint plots for the supramolecular interactions between ethanol and Dy(Ⅲ)-containing molecules, the contribution of O···H contacts are similar (Fig. S13 in Supporting information) [49,50]. However, the contribution of N···H contact in 2 is significantly reduced and tends to be absent (Fig. S14 in Supporting information) because H2DAPP ligands have not lost their protons and cannot form O−H···N hydrogen bonds with ethanol molecules. The shortest intermolecular Dy···Dy distances are very similar, measuring 9.3473(9) Å for 1 and 9.1728(9) Å for 2, indicating intermolecular magnetic interactions can be ignored (Figs. S7 and S8 in Supporting information). Therefore, the influence of crystal packing motifs does not need to be taken into account, and the following only considers the effect of protonation degree on the magnetic relaxation of the complexes.
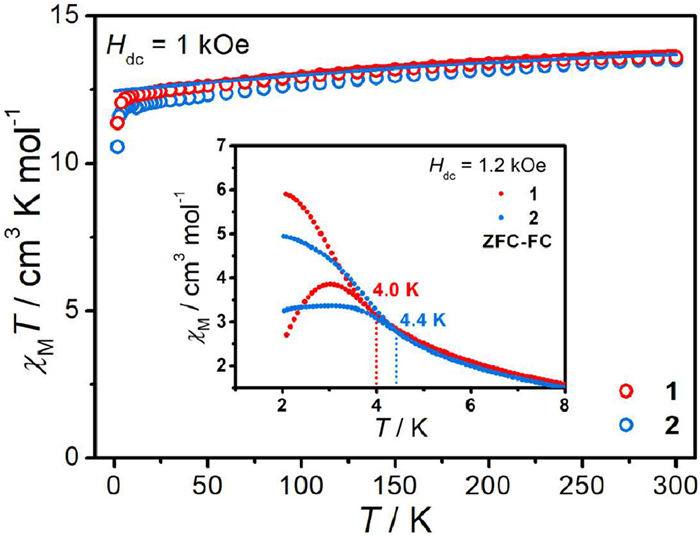
Variable-temperature magnetic susceptibilities of 1 and 2 were measured on polycrystalline samples under 1 kOe direct current (dc) field (Fig. 2). The χMT values at 300 K are 13.60 and 13.50 cm3 K/mol, respectively, which are slightly lower than that expected for an isolated Dy(Ⅲ) ion (6H15/2, 14.17 cm3 K/mol). For both complexes, the χMT value decreases steadily and then descends rapidly owing to the depopulation of excited Stark sublevels and magnetic blocking. Zero-field-cooled/field-cooled (ZFC-FC) magnetizations were measured at a 1.2 kOe dc field. The ZFC peaks for both 1 and 2 are located at approximately 3 K, but the diverging temperature of the FC and ZFC curves for 1 (4.0 K) is lower than 2 (4.4 K). Butterfly-shaped magnetic hysteresis loops for 1 and 2 were recorded below 5 K (Fig. S16 in Supporting information). The higher diverging temperature and larger hysteresis opening for 2 indicate its superior magnetic blocking behaviors.
Figure 2
Figure 2.
Variable-temperature molar magnetic susceptibility data for 1 and 2. Solid lines correspond to the ab initio calculation results. Inset: plot of magnetic susceptibility vs. temperature during FC and ZFC measurements for 1 (red) and 2 (blue).
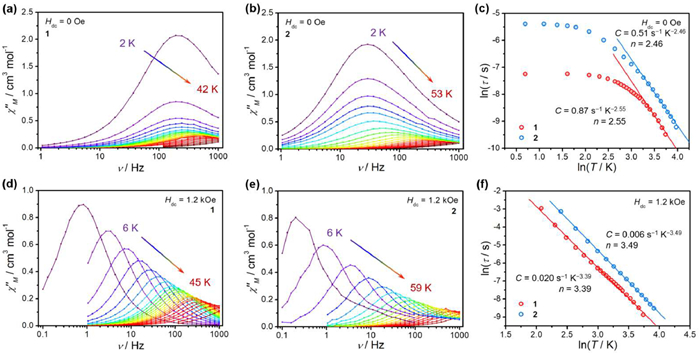
To further investigate the dynamic magnetic properties of complexes 1 and 2, variable-temperature and variable-frequency alternating-current (ac) magnetic susceptibilities were measured (Fig. 3). Without applying a dc field, the temperature-dependent χ''M (999 Hz) shows a maximum at 30 K for 1 and 44 K for 2.The higher peak temperature indicates slow magnetic relaxation exists at higher temperatures. The emergence of "tails" at low temperatures suggests the presence of a fast QTM process (Figs. S20 and S22 in Supporting information), which is supported by the absence of peak shifts in the frequency-dependent signals in the low-temperature regime. As shown in Figs. 3a and b, complex 1 exhibits a more severe QTM process and faster magnetic relaxation compared to 2.
Figure 3
Figure 3.
Frequency-dependent (1–999 Hz) out-of-phase χ''M ac susceptibility signals for 1 at 2–42 K (a) and 2 at 2–53 K (b) under zero field. Frequency-dependent (0.1–999 Hz) out-of-phase χ''M ac susceptibility signals for 1 at 6–45 K (d) and 2 at 6–59 K (e) under 1.2 kOe field. Temperature dependence of the relaxation time τ for 1 (red) and 2 (blue) under zero (c) and optimal (f) dc fields. The red and blue lines are the best fit for the Raman relaxation process by using the equation of τ−1 = CTn.
The relaxation times (τ) at variable temperatures of 1 (2–42 K) and 2 (2–53 K) were extracted using the generalized Debye model [51,52]. The ln(τ) vs. T−1 plots present nonlinearities at the whole temperature range, which means the absence of the Orbach process (Fig. S25 in Supporting information). However, the ln(τ) vs. ln(T) plots show linear at high temperatures instead, which corresponds to Raman processes. Upon cooling, the deviations from linearity are caused by QTM processes. Raman parameters can be obtained by fitting only the high-temperature region (Fig. 3c), giving two virtually parallel fitting lines with C = 0.87(40) s−1 K−2.55 and n = 2.55(13) for 1, C = 0.52(10) s−1 K−2.46 and n = 2.46(5) for 2. Note that the exponent of Raman process is smaller than those in other SMMs (n = 3~6) and very close to the phonon bottleneck process (n = 2). This indicates relaxation process of both complexes is dominated by the bottleneck or Raman process [17]. In fact, the relaxation dynamics of these two complexes can be fitted well by a combination of Raman and QTM processes. Therefore, fixing the n values in the Raman term as the fitting values mentioned above (Fig. S25), using τ−1 = CTn + τQTM−1 to fit the entire process and obtain C and τQTM, giving C = 0.70(2) s−1 K−2.55, τQTM = 7.7(2) × 10−4 s for 1, and C = 0.490(7) s−1 K−2.46, τQTM = 47.1(10) × 10−4 s for 2. Throughout the entire temperature range, the relaxation time of 2 is always longer than 1, and the QTM rate of 2 at low temperature is around six times slower than 1.
The field-dependent ac measurements were respectively conducted at 15 K for 1 and 14 K for 2 (Figs. S17 and S18 in Supporting information). Relaxation times τ extracted from the ac magnetic data show that the optimal applied dc field for both complexes is about 1.2 kOe. Under the optimal field, the maximum peaking temperature of χ''M (999 Hz) is 39 K for 1 and 50 K for 2 (Figs. S20 and S22). The frequency dependence of χ''M signals at lower temperatures for both complexes suggests efficient inhibition of QTM (Figs. 3d and e).
Under a 1200 Oe field, well-defined linearity of ln(τ) vs. ln(T) plots are observed (Fig. 3f), indicating that QTM has been effectively suppressed, and the relaxation pathway can be regarded as dominated solely by Raman process. This provides an excellent model for studying how protonation affects the Raman relaxation. The parallel ln(τ) vs. ln(T) plots indicate similar Raman exponents n, with the fitting results of C = 0.020(2) s−1 K−3.39 and n = 3.39(4) for 1, C = 0.0056(4) s−1 K−3.49 and n = 3.49(2) for 2, respectively. Compared to zero field, the larger exponents n and the much smaller coefficients C under optimal field are attributed to modulation of energy gaps and spin-phonon coupling, which are common observed in other SMMs [53]. Despite n should be 9 in the long-wavelength approximation (or 5 in the presence of low-lying states) for Kramers ions, a slight reduction (3–6) is still reasonable when considering the presence of both acoustic and optical phonons [14,16,17]. Since the discrepancy in exponents n of 1 and 2 can be ignored under the optimal field, the Raman efficiency CTn is determined by the coefficient C. The coefficient of 1 is approximately 3.54 times greater than 2, which triggers greater Raman efficiency CTn and acceleration of relaxation rate. This suggests that variations in deprotonation within the equatorial plane can effectively regulate the Raman processes.
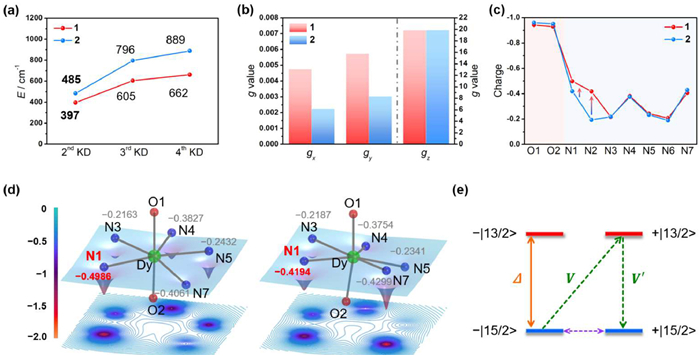
Complete active space self-consistent field (CASSCF) ab initio calculations were conducted using the OpenMOLCAS program to gain a clear understanding of the magnetic anisotropy of 1 and 2 (see more details in Supporting information) [54–56]. The calculated energy spectra, g tensors, and decomposition of RASSI wave functions of 6H15/2 multiplets of Dy(Ⅲ) are listed in Tables S4 and S5 (Supporting information). For 1, the 6H15/2 term splits into eight Kramers doublets (KDs) from 0 to 1046.56 cm−1. The wavefunction of ground KD is mainly composed of a mixture of 99.8% |±15/2 > components. For 2, the calculated eight KDs span from 0 to 1277.99 cm−1, and the wavefunctions of ground KD is much purer than 1 with 99.9%|±15/2 > . Comparing the g-factors of their ground KDs, both Dy(Ⅲ) ions show strong axial anisotropy with a gz tensor of up to 19.9 (Fig. 4b). However, the transverse components of 1 (gx = 0.0047 and gy = 0.0057) are larger than those of 2 (gx = 0.0023 and gy = 0.0031), indicating a more severe tunneling process in 1. Additionally, the weight of B20 in 1 is 24.9% (−4.38 cm−1), which is smaller than 34.74% in 2 (−5.87 cm−1). The total weight of transverse CFs B2q (q ≠ 0) in 1 (25.8%) is also greater than it in 2 (18.3%) (Table S9 in Supporting information). These results highlight the stronger anisotropy and slower QTM rate in complex 2.
Figure 4
Figure 4.
(a) The calculated energy levels of Kramers doublets for 1 (red) and 2 (blue). (b) The calculated g tensors of the ground Kramers doublet in 1 (red) and 2 (blue). (c) LoProp charges of O and N atoms around Dy(Ⅲ) site in 1 (red) and 2 (blue). (d) Surface map with contours of ESP at the equatorial plane for 1 (left) and 2 (right) without considering the charge of O atoms in axial. The numbers next to the equatorial donor atoms represent the LoProp charges. (e) Schematic diagram of the Raman process, which involves the first excited state energy barrier (Δ) and crystal-field splitting matrix elements (V and V').
To better understand the direct impact of protonation degree on the charge distribution of chemical environment around Dy(Ⅲ) sites, the LoProp charges of O and N atoms in 1 and 2 were calculated (Table S8 in Supporting information and Fig. 4c). The average negative charges of axially coordinated O atoms (−0.9361 in 1 and −0.9558 in 2) are much higher than that of planar N atoms (−0.3390 in 1 and −0.2943 in 2), in line with the anisotropic 4f shell. Thanks to the highly similar coordination sphere for both complexes, the effect of different protonation on charge can be can intuitively observed. As shown in Fig. 4c, the bis-hydrazone ligand in complex 2 is fully protonated, resulting in similar charge on N2 and N6. On the contrary, in 1, only N2 loses one proton, leading to the charge increase of more than 100% compared to N6. Even though N2 is uncoordinated with Dy, the induction and conjugation effects within the bis-hydrazone ligand significantly alter the charge distribution in the coordination sphere. Comparing the charges of N atoms in the first coordination sphere (Fig. 4d), the charge of N1 in 1 is approximately 19% higher than in 2, while the charges at other sites remain almost unchanged. This creates a stronger asymmetric charge distribution in 1, resulting in stronger transverse CFs and faster QTM.
ESP (φ) can provide a more intuitive visual description of the charge distribution in the first coordination sphere [34,57]. The ESP at the least squares plane of the equatorial donor atoms is shown by surface plots with contours (Fig. 4d). For an ideal D5h charge distribution, the inner ESP contours around Dy would be like a circle [34]. Without considering the charge of O atoms in the axial, the inner contours show a large "Ω" shape which means excess charges on N1 and N7. This shape is different from the reported "heart" shape of [DyLO2N3(LADTP)2]– and is far less close to the ideal D5h charge distribution than [DyLS2N3(LADTP)2]–, where H2LO/S2N3 = 2,6-diformylpyridine bis(semicarbazone)/bis(thiosemicarbazone) [34]. As expected, the slow magnetic relaxation time of 1 and 2 are shorter than [DyLS2N3(LADTP)2]–. Compared to 2, after the loss of one proton in 1, the charge on N1 becomes more excess thus cause a more asymmetric charge distribution and faster relaxation.
The iso-surface maps including O atoms in axial at the radial value 〈r4f〉 of 1 (φiso= −0.823 a.u.) and 2 (φiso= −0.828 a.u.) are shown in Fig. S31 (Supporting information) [34,57]. Complex 1 features a pz-electron-cloud-like axial part interacting with N1, while 2 shows a more scattered and symmetrical distribution of iso-surfaces. And the calculated values of charge distribution shape calculation (CDSC) for 2 is slightly less than 1 (Figs. S28 and S29 in Supporting information), as partial asymmetry has been "repaired" by the presence of a pair of protons.
Raman relaxation can be described by two critical variables, n and C, which are generally related to their electronic structures and phonon spectra. Complexes 1 and 2 show nearly identical n exponents under zero field or 1.2 kOe field, primarily due to their high similarity in structural frameworks [58]. However, the C coefficients are distinct for them. To rationale this and further investigate their intrinsic correlation of the Raman relaxation, we can use the Raman relaxation formula developed by Shrivastava [22,59]. In the case of Kramers systems in spin-one-phonon interaction in 2nd order, the probability of such relaxation is related to |V·V'| and inversely related to the energy differences between ground and excited states Δ. The V and V' are the derivatives of crystal field potential, which is the same manner as the crystal-field splitting matrix elements in Steven operators, provided the isotropic strains in the lattice proposed by Orbach [16]. Besides, assuming energy level splitting is much greater than Debye cut-off frequency and intermolecular interactions etc. are neglected to simplify the model and derived the following relationship (Eq. 1) (Fig. 4e).
where C is the coefficient of Raman process, V is crystal-field splitting matrix element between the |−15/2> and the first excited state |+13/2>, V' is the element between |+15/2> and |+13/2>, which both can be obtained from ab initio calculated crystal-field splitting matrix written on the basis of pseudospin eigenfunctions. Δ is the first excited state energy barrier calculated (Tables S6 and S7 in Supporting information).
According to this proportional relationship, the ratio of Raman coefficient term C for two complexes can be obtained (Table 1). When considering only the ground state and 21 sextets for Dy(Ⅲ), the C value of 1 is 2.48 times that of 2. After taking all spin states of Dy(Ⅲ) into account, the theoretical ratio becomes 2.73, which is closer to the experimental value ratio of C under the optimal field (3.54). The deviation between the theoretical and experimental values in both cases can be attributed to the assumption about ε mentioned above is not entirely valid. However, incorporating all spin-states in this model reduces the deviation to some extent. Notably, the ratio of C1 to C2 consistently exceed 100%, as the proton loss from the bis-hydrazone moiety in complex 1. This results in a more asymmetric charge distribution, enhancing the transverse CFs and generating larger off-diagonal matrix elements. Consequently, these changes lead to an enhancement in Raman efficiency and a corresponding reduction in relaxation time.
Table 1
Table 1.
The ratio of coefficient C in the Raman relaxation process of complexes 1 and 2.a
a Obtained from CASSCF calculations considered with the ground spin state (S = 5/2) or all spin states (S = 5/2, 3/2, 1/2). V and V' are crystal-field splitting matrix elements obtained from ab initio calculated crystal-field splitting matrix written on the basis of pseudospin eigenfunctions. Δ is the first excited state energy barrier. C is the coefficient of the Raman relaxation process.
In summary, two Dy(Ⅲ)-based SIMs with PBP symmetry were successfully synthesized, which possess highly similar molecular skeletons but different levels of protonation in the planar bis-hydrazone moiety. Magnetic characterization reveals that protonation significantly affects their relaxation behaviors. Complex 2 exhibits slower relaxation dynamics under both zero and optimal fields compared to 1. Intriguingly, the degree of protonation shows a slight impact on the Raman exponent n but causes a distinct variation in the Raman relaxation coefficient C. Combing ab initio and ESP calculations, the magneto-structural relationship was analyzed in detail. The deprotonation in 1 exacerbates the originally asymmetric charge distribution on the plane, resulting in much larger transverse fields and off-diagonal matrix elements. Consequently, the Raman relaxation process coefficient C increases by 3.5 times, leading to larger Raman efficiency and faster relaxation time. This study elucidates the important role of charge distribution in the Raman relaxation process and provides a novel regulation approach for a deeper comprehension of its underlying mechanisms.
Declaration of competing interest
The authors declare that they have no known competing financial interests or personal relationships that could have appeared to influence the work reported in this paper.
CRediT authorship contribution statement
Ying-Qian Zhou: Writing – original draft, Data curation. Chan-Ying Yao: Methodology, Data curation. Ze-Yu Ruan: Formal analysis, Data curation. Bang-Heng Lyu: Data curation. Shan-Nan Du: Visualization. Si-Guo Wu: Methodology, Formal analysis. Yan-Cong Chen: Methodology, Data curation. Wei Deng: Writing – review & editing, Validation, Methodology, Data curation. Jun-Liang Liu: Writing – review & editing, Supervision, Resources, Project administration, Funding acquisition, Conceptualization. Ming-Liang Tong: Supervision, Resources, Funding acquisition.
Acknowledgments
This work was supported by the National Natural Science Foundation of China (NSFC, Nos. 22475246, 22488101, 22131011, 22105230 and 22405300), the China Postdoctoral Science Foundation (No. 2024M763735), the Fundamental Research Funds for the Central Universities, and Sun Yat-sen University (Nos. 24xkjc003 and 24qnpy051).
Supplementary materials
Supplementary material associated with this article can be found, in the online version, at doi:10.1016/j.cclet.2025.111179.
[1]
R. Sessoli, D. Gatteschi, A. Caneschi, et al., Nature 365 (1993) 141–143. doi: 10.1038/365141a0
[2]
M.N. Leuenberger, D. Loss, Nature 410 (2001) 789–793. doi: 10.1038/35071024
[3]
L. Bogani, W. Wernsdorfer, Nat. Mater. 7 (2008) 179–186. doi: 10.1038/nmat2133
Figure 1
(a) Reaction scheme for the synthesis of 1 and 2. (b) Molecular structures from single-crystal X-ray diffraction of 1 (left) and 2 (right). (c) The planar coordination environments around Dy(Ⅲ) of 1 (left) and 2 (right). Color codes: Dy, green; O, red; N, blue; S, yellow; C, gray; H, sky blue. Partial hydrogen atoms, solvent molecules, and disordered components are omitted for clarity.
Figure 2
Variable-temperature molar magnetic susceptibility data for 1 and 2. Solid lines correspond to the ab initio calculation results. Inset: plot of magnetic susceptibility vs. temperature during FC and ZFC measurements for 1 (red) and 2 (blue).
Figure 3
Frequency-dependent (1–999 Hz) out-of-phase χ''M ac susceptibility signals for 1 at 2–42 K (a) and 2 at 2–53 K (b) under zero field. Frequency-dependent (0.1–999 Hz) out-of-phase χ''M ac susceptibility signals for 1 at 6–45 K (d) and 2 at 6–59 K (e) under 1.2 kOe field. Temperature dependence of the relaxation time τ for 1 (red) and 2 (blue) under zero (c) and optimal (f) dc fields. The red and blue lines are the best fit for the Raman relaxation process by using the equation of τ−1 = CTn.
Figure 4
(a) The calculated energy levels of Kramers doublets for 1 (red) and 2 (blue). (b) The calculated g tensors of the ground Kramers doublet in 1 (red) and 2 (blue). (c) LoProp charges of O and N atoms around Dy(Ⅲ) site in 1 (red) and 2 (blue). (d) Surface map with contours of ESP at the equatorial plane for 1 (left) and 2 (right) without considering the charge of O atoms in axial. The numbers next to the equatorial donor atoms represent the LoProp charges. (e) Schematic diagram of the Raman process, which involves the first excited state energy barrier (Δ) and crystal-field splitting matrix elements (V and V').
Table 1.
The ratio of coefficient C in the Raman relaxation process of complexes 1 and 2.a
Complexes
CASSCF accounted for ground spin
CASSCF accounted for all spins
Experimental ratio
|V · V′|2
Δ (cm−1)
C1/C2
|V · V′|2
Δ (cm−1)
C1/C2
C1/C2
1
1.29E−05
397.50
2.48
6.91E−06
396.76
2.73
3.54
2
1.14E−05
483.95
5.65E−06
484.88
a Obtained from CASSCF calculations considered with the ground spin state (S = 5/2) or all spin states (S = 5/2, 3/2, 1/2). V and V' are crystal-field splitting matrix elements obtained from ab initio calculated crystal-field splitting matrix written on the basis of pseudospin eigenfunctions. Δ is the first excited state energy barrier. C is the coefficient of the Raman relaxation process.


 DownLoad:


 下载:
下载:


 下载:
下载:

