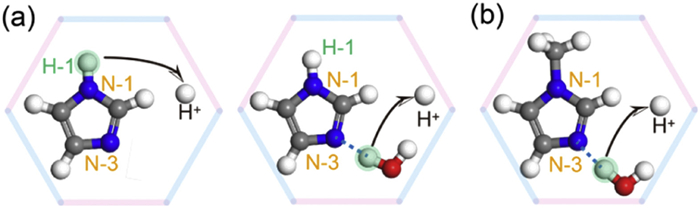
Figure 1.
(a) Protons dissociation from N-1 and N-3···H2O H-bond of imidazole. (b) Protons dissociation from N-3···H2O H-bond of 1-methylimidazole.
N-3 of 1-methylimidazole: Enhancing proton conduction in COF under humidity conditions
Kun Zhang , Lei Wu , Kaixi Lan , Yanting Zhang , Wenxin Zhang , Huanhuan Li , Guoji Huang , Dongshuang Wu , Long Chen , Manni Li

Proton exchange membrane fuel cells (PEMFCs) are highly regarded for their potential in vehicle applications due to their high power density and minimal emissions [1–4]. Current PEMFCs using Nafion as the electrolyte exhibit excellent proton conduction at 60–80 ℃ and 98% relative humidity (RH) [5]. However, the high cost and complex production of Nafion membranes limit their widespread adoption [6]. Moreover, the amorphous structure of Nafion polymers hinders the detailed investigation of proton conduction pathways and mechanisms, thus constraining performance improvements [7]. Therefore, there has been a surge in research aimed at discovering novel proton conductors with low cost, well-defined structure and high proton conductivity.
Emerging crystalline porous materials, including coordination polymers (CPs) [8–10], covalent-organic frameworks (COFs) [11–16] and metal-organic frameworks (MOFs) [17–22], are considered as promising proton conductors, highlighted by their structural flexibility, periodicity, and porosity benefiting for proton transfer [23–26]. Since Kitagawa embedded imidazole (Im) molecules into MOFs to enhance proton conduction [27], the proton conduction mechanism in Im-frameworks system has attracted much researchers' attentions [28–37]. For a long time, the hydrogen at the 1-position (H-1) of imidazole has been considered the only source of mobile proton [38], because N-1 can easily release H-1 due to that its non-bonding electrons engage in imidazole ring conjugation and reduced electron cloud density (Fig. 1a). However, in hydrous conditions, the 3-position nitrogen atom (N-3) may contribute to mobile proton as well. The non-bonding electron pair on the N-3 does not participate in conjugation but occupies sp2 hybridized orbital, which helps N-3 form an H-bond with water, promoting proton ionization from water and facilitating its transfer (Fig. 1a). Such H-bond effect should be more intense in Im-frameworks system, as the confined space can lead guest molecules to be more crowded, shortening the lengths of H-bonds [39].
Building on the aforementioned concept, we have successfully confined 1-methylimidazole (Im-CH3) within the nano-space of one COF (Im-CH3@COF), resulting in a remarkable proton conductivity of 2.40 × 10⁻³ S/cm at 70 ℃ and 100% RH. This performance is on par with that of COF doped with imidazole (Im@COF). The exceptional proton conduction is attributed to the robust hydrogen-bonding interaction between the N-3 sites of Im-CH3 and water molecules within the framework (Fig. 1b), which produces mobile proton and facilitate proton diffusion. This research underscores the significant role of N-3 in imidazole and its derivatives in enhancing proton conduction under humidity conditions. Furthermore, it challenges the conventional viewpoint that the H-1 of imidazole is the sole contributor to proton concentration.
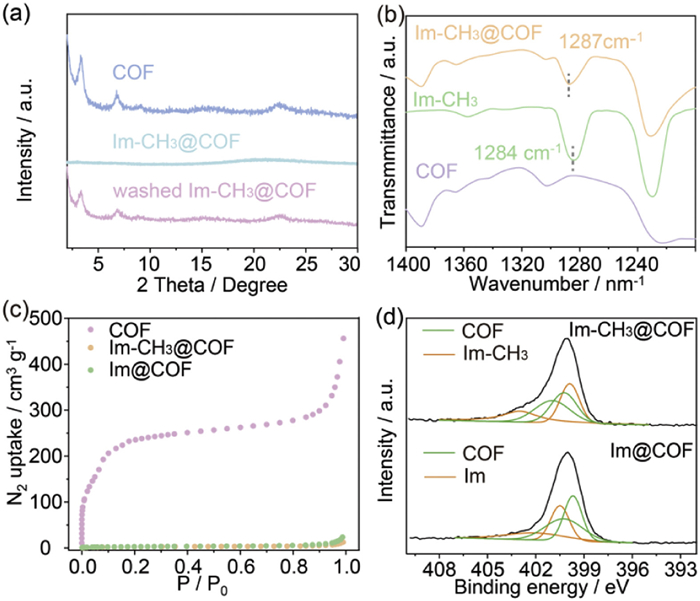
The COF membranes are synthesized via interfacial polymerization (left in Fig. S1 in Supporting information) [40], and their structure is identical to the previously reported COF-42 (middle in Fig. S1) [41], featuring one-dimensional channels with a pore size of 2.8 nm (Fig. S2 in Supporting information). Subsequently, 1-methylimidazole and imidazole molecules are loaded into the pores of the COF membrane respectively, resulting in composites of Im-CH3@COF and Im@COF (right in Fig. S1). Due to the lattice expansion induced by the incorporation of guest molecules, the powder X-ray diffraction (PXRD) peaks of COF disappear. However, the diffraction peaks reappear after removing guest molecules (Fig. 2a, Figs. S3 and S4 in Supporting information), suggesting remained framework structure. The thermogravimetric curves of Im-CH3@COF and Im@COF show the characteristic weight loss stage belonging to Im-CH3 and Im (Fig. S5 in Supporting information). The v C—N is 1264 cm-1 for bulk Im and 1256 cm-1 for Im@COF [42], and is 1284 cm-1 for bulk Im-CH3 and 1287 cm-1 for Im-CH3@COF (Fig. 2b, Figs. S6 and S7 in Supporting information) [38]. The red shift is due to H-bond formed between Im and water in COF, while the blue shift is due to a more dispersed state of Im-CH3 in COF. The different shift direction of v C—N also indicates that methyl has steric hindrance effect, which hinders the formation of hydrogen bonds between C—N on Im-CH3 and water. The maximum nitrogen adsorption amount decreases significantly, from 456.2 cm3/g of COF to 12.6 cm3/g of Im-CH3@COF and 23.6 cm3/g of Im@COF (Fig. 2c). These confirm the successful incorporation of guest molecules. SEM images of the COF composites are shown in Fig. S8 (Supporting information), and corresponding mapping results show the uniform distribution of elements (Fig. S9 in Supporting information). Based on X-ray photo electron spectroscopy (XPS), COF has two peaks at 400.97 and 400.04 eV (green line), corresponding to C=N and C—N on the framework (Fig. S10 in Supporting information). At same time, there are two different peaks at 402.98 and 399.89 eV (orange line) for Im-CH3@COF, and two different peaks at 402.02 and 400.05 eV (orange line) for Im@COF (Fig. 2d). These peaks belong to Im-CH3 and Im respectively. According to the peak area integration of N elements on the guest molecules and the framework, there are 5.3 Im-CH3 molecules per pore in Im-CH3@COF, and 4.1 Im molecules per pore in Im@COF. The elemental analysis shows 5.1 Im-CH3 molecules per pore in Im-CH3@COF, and 4.4 Im molecules per pore in Im@COF, which is consistent with XPS results (Table S2 and Fig. S10 in Supporting information). The binding energies between the COF fragments and the guest molecule are 27.56 and 21.55 kJ/mol for Im-CH3@COF, and 10.01 kJ/mol for Im@COF (Fig. S11 in Supporting information). In addition, Im-CH3 exhibits a more dispersed liquid state at room temperature (imidazole is solid). All of these have resulted in a higher content of Im-CH3 in COF.
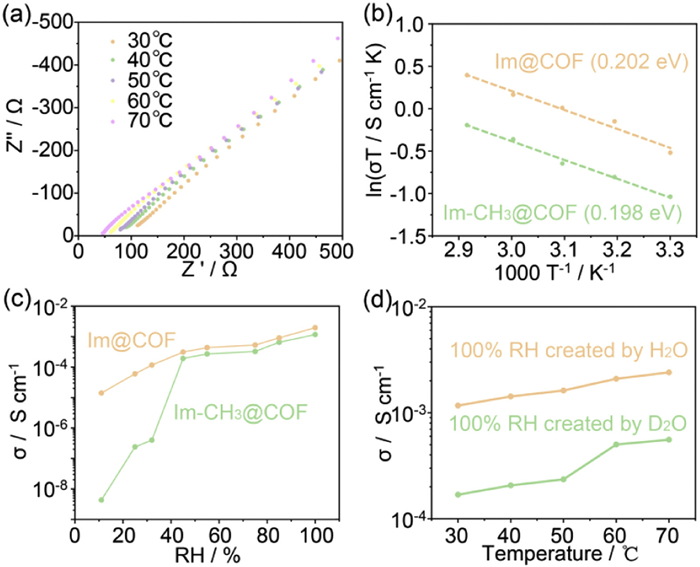
The behavior of proton transport is evaluated using electrochemical impedance spectroscopy (EIS), as depicted in Fig. 3a and Figs. S15-S25 (Supporting information). The COF membrane exhibits a proton conductivity of 6.97 × 10⁻⁶ S/cm at 30 ℃ and 100% RH, markedly lower than that of Im@COF (1.96 × 10⁻³ S/cm) and Im-CH3@COF (1.17 × 10⁻³ S/cm) (Fig. S15). At 70 ℃ and 100% RH, Im-CH3@COF and Im@COF exhibit peak proton conductivity of 2.40 × 10⁻³ and 4.33 × 10⁻³ S/cm (Fig. 3a, Figs. S16 and S17). These values are comparable to those of other MOFs/COFs based proton conductors (Table S3 in Supporting information). The two samples have stable proton conduction, maintaining almost unchanged proton conductivity at 70 ℃ and 100% RH for 48 h (Fig. S18). The structure has not changed after long tome proton conducting measurement, which is demonstrated by IR, XRD and element analysis (Figs. S12 and S13, Table S2). We also reduced the content of imidazole based guest molecules (Fig. S14). The proton conductivity immediately decreases, and the activation energy also increases, demonstrating the key role of Im and Im-CH3 in improving proton conduction. For example, the COF with 3.7 Im-CH3 has proton conductivity of 6.33 × 10⁻⁴ S/cm at 70 ℃ and 100% RH. This value is one order of magnitude lower than that of Im-CH3@COF (5.3 Im-CH3) (Fig. S19). The activation energies for Im@COF and Im-CH3@COF are very close, being 0.202 eV and 0.198 eV, respectively (Fig. 3b). Both belong to the Grotthuss-type proton conduction mechanism [43], where protons are transferred along the hydrogen-bonding networks. As the relative humidity decreases from 100% RH to 11% RH, the proton conductivity of Im@COF decreases by about two orders of magnitude (from 1.95 × 10⁻³ S/cm to 1.40 × 10⁻⁵ S/cm), while the proton conductivity of Im-CH3@COF decreases by more than five orders of magnitude (from 1.16 × 10⁻³ S/cm to 4.3 × 10⁻⁹ S/cm) (Fig. 3c and Figs. S20-S23). The proton conduction of Im-CH3@COF has a higher degree of dependence on water molecules (Fig. 3c). This is largely because water is its only source of mobile protons. In contrast, both H-1 and water generate free protons for Im@COF. Im-CH3@COF is also placed in a deuterated water-controlled environment (100% RH), and the resulting proton conductivity is obvious lower than that obtained in an environment controlled by ordinary water (100% RH) (Fig. 3d and Fig. S24). For example, the σ value at 50 ℃ is 2.35 × 10⁻⁴ S/cm and 1.62 × 10⁻³ S/cm for Im-CH3@COF in D2O and H2O. The activation energy also increases to 0.282 eV for Im-CH3@COF in D2O (0.198 eV for Im-CH3@COF in H2O) (Fig. 3b and Fig. S25). These above prove the important role of water in proton conduction of Im-CH3@COF, i.e., water provide the source of free protons and participate in proton transition as medium.
The binding energy between Im-CH3 and water (N-3···H2O) is 25.23 kJ/mol, which is larger than that between Im and water (23.94 kJ/mol for N-3···H2O, 17.20 kJ/mol for H-1···OH2) (Fig. 4a). This indicates that Im-CH3 can form stronger H-bond with water in framework than Im. As results, Im-CH3@COF becomes more hydrophilic. The hydrophobic angle of Im-CH3@COF is 0°, which is smaller than that of Im@COF (5°) (Fig. 4b). In addition, over a wide range of humidity, the water adsorption capacity of Im-CH3@COF is greater than that of Im@COF. For example, the maximum water adsorption amount of Im-CH3@COF is 329.46 cm3/g, which is larger than that of Im@COF (169.82 cm3/g) (Fig. 4c). Benefit from the greater amount of adsorbed water, a tight hydrogen bond network is formed in Im-CH3@COF. Specifically, according to radial distribution functions (RDF), both N-3···Hw (Hw and Ow are atoms in water) in Im-CH3@COF and Im@COF obtain minimum distance of 1.76 Å. But the 1.76 Å is much more centered in Im-CH3@COF than that in Im@COF (Fig. 4d). The N-3···Hw in Im-CH3@COF is also much shorter than H-1···Ow in Im@COF, which is 2.60 Å. There is one obvious Hw···Ow signal at 1.79 Å in Im-CH3@COF, but it is nearly non-existent in Im@COF (Fig. S26 in Supporting information). All these RDF results prove the robust H-bond network in Im-CH3@COF. What's more, an amorphous box with the same number of Im-CH3 and water as Im-CH3@COF is also constructed, and RDF shows that its H-bond is weaker than that of Im-CH3@COF (Fig. S27 in Supporting information). This demonstrates that the tight H-bond network is also closely related to the confinement effect.
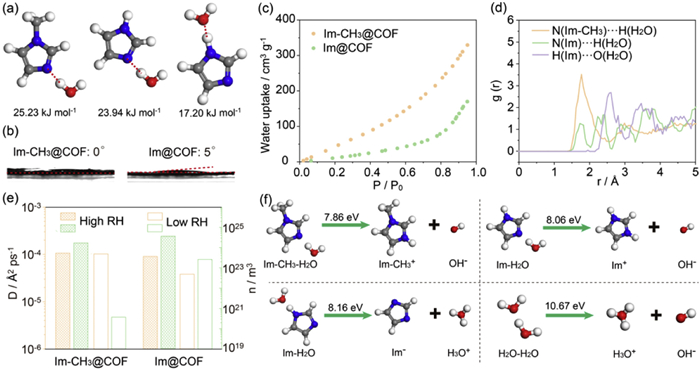
Due to the robust H-bond network, molecular dynamics (MD) simulation shows that the diffusion constant at 100% RH and 30 ℃ is 1.06 × 10⁻⁴ Å2/ps of Im-CH3@COF, which is higher than that of Im@COF (9.01 × 10⁻⁵ Å2/ps) (Fig. 4e and Fig. S28 in Supporting information). The proton concentration is calculated based on Einstein's equation:
|
|
(1) |
where σ, q, D, n, kB, and T represent the proton conductivity, charges, diffusion constant, carrier concentration, Boltzmann constant and absolute temperature [44]. The proton concentration of Im-CH3@COF is 1.79 × 1024/m3, which is within the same order of magnitude as that of Im@COF (3.53 × 1024/m3) (Fig. 4e).
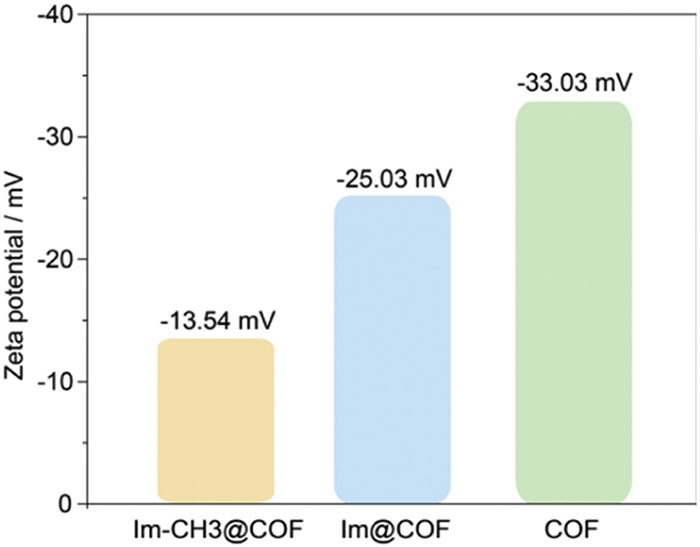
The proton concentration is determined by the number of sites available for proton dissociation and their capacity to release protons. For Im-CH3@COF, the number of sites for dissociating protons is smaller (5.3 N-3 atoms per pore for Im-CH3@COF, 4.1 N-3 and 4.1 H-1 atoms per pore for Im@COF). However, it needs lower energy to release proton. As shown in Fig. 4f, the proton dissociation energy is 7.86 eV for Im-CH3···H2O, which is smaller than those of Im···H2O (8.06 and 8.16 eV) and water (10.67 eV). This is the main reason for Im-CH3@COF having a comparable proton concentration to Im@COF. At low humidity (25% RH), the diffusion constant of Im-CH3@COF and Im@COF does not significantly decrease (1.04 × 10⁻⁴ Å2/ps for Im-CH3@COF and 3.77 × 10⁻⁵ Å2/ps for Im@COF), but the proton concentration drops by 4 and 1 orders of magnitude (3.75 × 10²⁰/m3 for Im-CH3@COF and 2.60 × 10²³/m3 for Im@COF), respectively. Im-CH3@COF experiences a more significant loss in proton concentration, as N-3···H2O serves as the only source of mobile protons, whereas Im@COF possesses both N-3···H2O and H-1. The Zeta potential (ζ) is −13.54, −25.03 and −33.03 mV for Im-CH3@COF, Im@COF and COF (Fig. 5). The highest ζ value of Im-CH3@COF is attributed to the positive surface charge of the product formed upon its reaction with water. In contrast, the reaction of imidazole with water yields two distinct products with opposite surface charges. This further confirms the ability of N-3···H2O to dissociate protons.
In summary, two solid-state proton conductors of Im-CH3@COF and Im@COF are fabricated by introducing 1-methylimidazole and imidazole into covalent organic frameworks, respectively. The Im-CH3@COF obtains maximum proton conductivity of 2.40 × 10⁻³ S/cm at 70 ℃ and 100% RH, which is comparable to Im@COF. The remarkable proton conduction is attributed to the 3-position nitrogen atom in 1-methylimidazole, which can form robust hydrogen bond with water, promoting proton ionization from water and proton transfer. This work also indicates that the hydrogen at the 1-position of imidazole is not the only source of proton concentration, challenging the traditional view.
The authors declare that they have no known competing financial interests or personal relationships that could have appeared to influence the work reported in this paper.
Kun Zhang: Supervision. Lei Wu: Investigation. Kaixi Lan: Data curation. Yanting Zhang: Methodology. Wenxin Zhang: Software. Huanhuan Li: Formal analysis. Guoji Huang: Writing – original draft. Dongshuang Wu: Resources. Long Chen: Project administration. Manni Li: Writing – review & editing.
This work was supported by National Natural Science Foundation of China (No. 52207238), China Postdoctoral Science Foundation (No. 2023M731361) and Jiangsu University Senior Talent Launch Fund. The author is grateful to Hong Zhang from Jiangsu University for the discussion of simulation calculations.
Supplementary material associated with this article can be found, in the online version, at doi:
L. Xing, W. Shi, H. Su, Q. Xu, et al., Energy 177 (2019) 445–464. doi: 10.1016/j.energy.2019.04.084
Z. Xie, L. Tian, W. Zhang, et al., Int. J. Hydrogen. Energy 46 (2021) 10903–10912. doi: 10.1016/j.ijhydene.2020.12.153
W. Zhang, Z. Jiang, Y. Lu, et al., Int. J. Hydrogen. Energy 50 (2024) 1004–1019.
K. Zhang, G.H. Wen, X.J. Yang, et al., ACS. Mater. Lett. 3 (2021) 744–751. doi: 10.1021/acsmaterialslett.1c00176
H.B. Luo, L.T. Ren, W.H. Ning, et al., Adv. Mater. 28 (2015) 1663–1667.
Y. Ye, W. Guo, L. Wang, et al., J. Am. Chem. Soc. 139 (2017) 15604–15607. doi: 10.1021/jacs.7b09163
F.M. Zhang, L.Z. Dong, J.S. Qin, et al., J. Am. Chem. Soc. 139 (2017) 6183–6189. doi: 10.1021/jacs.7b01559
D. Gui, W. Duan, J. Shu, et al., CCS Chem. 1 (2019) 197–206. doi: 10.31635/ccschem.019.20190004
D. Gui, Y. Zhang, H. Li, et al., Inorg. Chem. 61 (2022) 8036–8042. doi: 10.1021/acs.inorgchem.2c00844
C. Wang, Y. Shen, X. Wang, et al., ACS Appl. Mater. Interfaces 16 (2024) 22648–22656. doi: 10.1021/acsami.4c01241
G. Jiang, W. Zou, Z. Ou, et al., Angew. Chem. Int. Ed. 61 (2022) e202208086. doi: 10.1002/anie.202208086
L. Liu, L. Yin, D. Cheng, et al., Angew. Chem. Int. Ed. 60 (2021) 14875–14880. doi: 10.1002/anie.202104106
Y. Su, Y. Wan, H. Xu, et al., J. Am. Chem. Soc. 142 (2020) 13316–13321. doi: 10.1021/jacs.0c05970
B. Shi, X. Pang, S. Li, et al., Nat. Commun. 13 (2022) 6666. doi: 10.1038/s41467-022-33868-8
R. Sahoo, S. Mondal, S.C. Pal, et al., Adv. Energy. Mater. 11 (2021) 2102300. doi: 10.1002/aenm.202102300
K.C. Ranjeesh, R. Illathvalappil, S.D. Veer, et al., J. Am. Chem. Soc. 141 (2019) 14950–14954. doi: 10.1021/jacs.9b06080
W.L. Xue, W.H. Deng, H. Chen, et al., Angew. Chem. Int. Ed. 60 (2020) 1290–1297. doi: 10.1080/07294360.2020.1712679
A. Sharma, J. Lim, S. Lee, et al., Angew. Chem. Int. Ed. 62 (2023) e202302376. doi: 10.1002/anie.202302376
S.L. Zheng, C.M. Wu, L.H. Chung, et al., ACS Energy. Lett. 8 (2023) 3095–3101. doi: 10.1021/acsenergylett.3c00780
D. Gui, X. Dai, Z. Tao, et al., J. Am. Chem. Soc. 140 (2018) 6146–6155. doi: 10.1021/jacs.8b02598
S.S. Bao, K. Otsubo, J.M. Taylor, et al., J. Am. Chem. Soc. 136 (2014) 9292–9295. doi: 10.1021/ja505916c
J. Chen, B. An, Y. Chen, et al., J. Am. Chem. Soc. 145 (2023) 19225–19231. doi: 10.1021/jacs.3c03943
Y.S. Wei, X.P. Hu, Z. Han, et al., J. Am. Chem. Soc. 139 (2017) 3505–3512. doi: 10.1021/jacs.6b12847
X.M. Li, L.Z. Dong, J. Liu, et al., Chem 6 (2020) 2272–2282. doi: 10.1016/j.chempr.2020.06.007
M. Yang, H. Li, Y. Zhang, et al., Inorg. Chem. 62 (2023) 6467–6473. doi: 10.1021/acs.inorgchem.3c00486
B. Joarder, J.B. Lin, Z. Romero, G.K.H. Shimizu, J. Am. Chem. Soc. 139 (2017) 7176–7179. doi: 10.1021/jacs.7b03397
S. Bureekaew, S. Horike, M. Higuchi, et al., Nat. Mater. 8 (2009) 831–836. doi: 10.1038/nmat2526
D. Umeyama, S. Horike, M. Inukai, et al., Angew. Chem. Int. Ed. 50 (2011) 11706–11709. doi: 10.1002/anie.201102997
L. Cai, J. Yang, Y. Lai, et al., Angew. Chem. Int. Ed. 62 (2023) e202211741. doi: 10.1002/anie.202211741
K. Zhang, L. Wu, Y. Zhang, et al., ACS Appl. Mater. Interfaces 17 (2025) 963–968. doi: 10.1021/acsami.4c15871
N.H. Kwon, S. Han, J. Kim, et al., Small 19 (2023) 2301122. doi: 10.1002/smll.202301122
T. Zhang, Y. Xia, Y.D. Xie, et al., J. Colloid. Interf. Sci. 665 (2024) 554–563.
L. Zhang, X. Ma, X. Li, et al., Inorg. Chem. Front. 10 (2023) 7359–7368. doi: 10.1039/d3qi01941a
J.Q. Qiao, H.M. Ren, X. Chen, et al., Inorg. Chem. 62 (2023) 21309–21321. doi: 10.1021/acs.inorgchem.3c03400
J.X. Qu, Y.M. Fu, X. Meng, et al., Chem. Commun. 59 (2023) 1070–1073. doi: 10.1039/d2cc06214c
X. Ma, L. Zhang, R. Liu, et al., Inorg. Chem. 62 (2023) 20325–20339. doi: 10.1021/acs.inorgchem.3c03313
T.X. Luan, P. Zhang, Q. Wang, et al., Nano Lett. 24 (2024) 5075–5084.
H.B. Luo, Q. Ren, P. Wang, et al., ACS. Appl. Mater. Interfaces 11 (2019) 9164–9171. doi: 10.1021/acsami.9b01075
M.K. Sarango-Ramírez, J. Park, J. Kim, et al., Angew. Chem. Int. Ed. 60 (2021) 20173–20177. doi: 10.1002/anie.202106181
Z. Liu, K. Zhang, G. Huang, et al., Chem. Eng. J. 433 (2022) 133550.
F.J. Uribe-Romo, C.J. Doonan, H. Furukawa, et al., J. Am. Chem. Soc. 133 (2011) 11478–11481. doi: 10.1021/ja204728y
X. Li, L. Du, X. Lu, et al., Microchim. Acta 191 (2024) 90.
R. Sahoo, S.C. Pal, M.C. Das, ACS Energy Lett. 7 (2022) 4490–4500. doi: 10.1021/acsenergylett.2c02275
D.W. Lim, H. Kitagawa, Chem. Rev. 120 (2020) 8416–8467. doi: 10.1021/acs.chemrev.9b00842

Figure 1 (a) Protons dissociation from N-1 and N-3···H2O H-bond of imidazole. (b) Protons dissociation from N-3···H2O H-bond of 1-methylimidazole.

Figure 2 (a) PXRD spectra of COF, Im-CH3@COF and washed Im-CH3@COF. (b) IR plot of COF, Im-CH3@COF and Im-CH3. (c) N2 adsorption of COF, Im-CH3@COF and Im@COF. (d) XPS of Im-CH3@COF and Im@COF.

Figure 3 (a) Nyquist plot of Im-CH3@COF at 100% RH versus different temperatures. (b) Activation energy of Im-CH3@COF and Im@COF. (c) Proton conductivity of Im-CH3@COF and Im@COF versus different RH at 30 ℃. (d) Proton conduction of Im-CH3@COF in H2O and D2O vapor environment.

Figure 4 (a) The binding energy between the guest molecules and water. (b) Water contact angle of Im-CH3@COF and Im@COF. (c) Water adsorption of Im-CH3@COF and Im@COF. (d) Radial distribution functions of Im-CH3@COF and Im@COF. (e) Diffusion constant and mobile proton concentration of Im-CH3@COF and Im@COF. (f) Dissociation energies of proton in various conditions.

 扫一扫看文章

扫一扫关注我们
 DownLoad:
 下载:
下载:

 下载:
下载: