Key Laboratory of Research on Utilization of Si-Zr-Ti Resources of Hainan Province, School of Materials Science and Engineering, Hainan University, Haikou 570228, China
b.
School of Physics and Optoelectronic Engineering, Hainan University, Haikou 570228, China
c.
Nano Science and Technology Institute, University of Science and Technology of China, Suzhou 215123, China
d.
School of Materials Science and Engineering, Suzhou University of Science and Technology, Suzhou 215009, China
Received Date:
22 October 2024 Accepted Date:
06 January 2025 Revised Date:
20 December 2024 Available Online:
15 April 2026
Abstract:
Reversible modulation of the transmittance in electrochromic devices (ECDs) holds tremendous potential for energy-saving windows. The choice of electrolyte significantly influences the optical modulation, coloring response speed, coloring efficiency, and cycling stability of electrochromic devices. Moreover, traditional electrolytes are prone to instability under extreme temperature conditions, leading to device failure and severely limiting the widespread application of smart electrochromic windows. This study introduces LiCl water-in-salt electrolyte (WiSE) into tungsten oxide-based ECDs. LiCl WiSE exhibits wide-temperature tolerance and excellent ion conductivity. Therefore, the constructed tungsten oxide ECD demonstrates large optical modulation (76.2%@700 nm), fast response time (tc = 2.0 s, tb = 1.8 s), and high cycling stability (95.8% retention after 1000 cycles). Especially, it operates efficiently over a wide temperature range of -30~80 ℃. This research provides a new approach for electrolyte selection in the fabrication of high-performance, wide-temperature-tolerant ECDs.
Electrochromism involves the reversible dynamic modulation of the optical properties of electrochromic materials under applied voltage, and it finds wide applications in areas such as anti-glare mirrors, electrochromic windows, automotive sunroofs, and aircraft windows [1,2]. An electrochromic device (ECD) typically consists of a sandwich structure comprising an electrochromic electrode, an electrolyte layer, and an ion storage layer [3,4]. The electrolyte, serving as the ion-conducting medium between the electrochromic material and the ion storage layer, facilitates effective ion transfer to enable the reversible color changes [5,6]. Key parameters of the electrolyte include ionic conductivity, transparency, thermal stability and safety, playing crucial roles in the optical modulation, response time, cycling lifespan and temperature tolerance of ECDs [7]. Depending on their state of matter, electrolytes can be categorized into liquid, solid and gel electrolytes [8-11]. Among them, liquid electrolytes have the advantages of high ionic conductivity, easy preparation, and wide adaptability, which are currently the primary choice for ECDs [12].
Traditional liquid electrolytes are generally lithium and sodium salts dissolved in organic solvents, offering high conductivity and short response time but posing safety concerns such as flammability, toxicity, and pollution [13-15]. Compared to organic electrolytes, aqueous electrolytes are safe, environmentally friendly, and efficient, making them ideal alternatives [16-18]. However, traditional aqueous electrolytes suffer from several limitations that restrict their widespread application [19-22]. Firstly, the narrow working voltage window of traditional aqueous electrolytes is due to the high reactivity of free water molecules. Secondly, the abundance of polar water molecules in traditional aqueous electrolytes can damage the electrode material structure during cycling, leading to poor electrochemical stability. Thirdly, traditional aqueous electrolytes are prone to freezing at low temperatures and exhibit rapid stability decay at high temperatures, resulting in device failure. The extensive use of smart windows, particularly in applications requiring tolerance to extreme temperatures (−30~80 ℃), imposes stringent requirements on the selection of electrolyte for ECDs. Compared to traditional organic or aqueous electrolytes, LiCl WiSE maintains a higher conductivity in low-temperature environments. Additionally, its unique solvation effect helps suppress freezing and reduce viscosity at low temperatures, which promotes ion migration and charge transfer, improving the electrochromic device’s response speed and cycling stability.
In this work, LiCl water-in-salt electrolyte (WiSE) was used to construct ECD, employing tungsten oxide as the electrochromic functional layer. The extremely low content of free H2O in the WiSE enhances its electrochemical stability at both high and low temperatures, with reduced damage to the electrode material. Additionally, experimental results indicate that WiSE exhibits high ionic conductivity and low desolvation energy barriers, which facilitate the insertion/extraction of Li+ in tungsten oxide. As a result, the fabricated ECD exhibited high optical modulation (ΔT = 76.2%@700 nm), fast response times (tc = 2.0 s, tb = 1.8 s), and excellent cycling stability (95.8% retention after 1000 cycles). Importantly, this device operated effectively in extreme temperature environments from −30 ℃ to 80 ℃. This work provided an attractive candidate electrolyte for high-performance, all-temperature-tolerant ECDs.
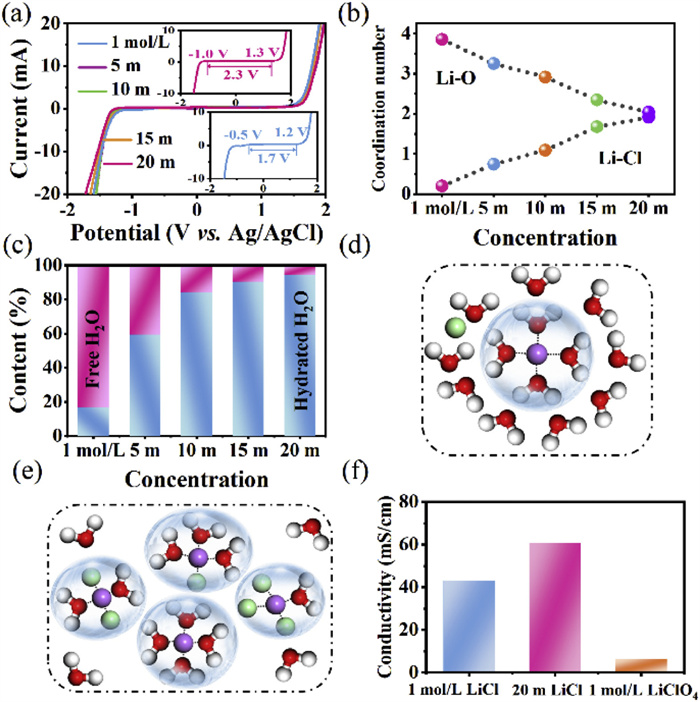
The electrolyte layer plays a crucial role in the performance of electrochromic devices, especially in terms of temperature tolerance. This study introduces the incorporation of a LiCl WiSE into ECDs to enhance their performance and temperature tolerance. Fig. S1 (Supporting information) presents optical photographs of different concentrations of LiCl electrolytes ranging from 1 mol/L to 20 mol/kg. All electrolytes exhibit a colorless and transparent state, meeting the optical transmittance requirements of electrochromic electrolytes. Electrochemical stability and ion conductivity are important parameters for electrolyte selection in ECDs. The electrochemical stability window of aqueous LiCl solutions with different concentrations was investigated by conducting linear sweep voltammetry (LSV) scans at 10 mV/s on inert titanium foil electrodes [23]. As shown in Fig. 1a, with an increase in the electrolyte concentration, the electrochemical stability window of the electrolyte gradually expands. Compared to the electrochemical stability window of 1.7 V (−0.5~1.2 V vs. Ag/AgCl) for the 1 mol/L LiCl aqueous electrolyte, the stability window expands to 2.3 V (−1.0~1.3 V vs. Ag/AgCl) for the 20 mol/kg LiCl electrolyte. This indicates that concentrated LiCl electrolytes can suppress the oxygen evolution reaction (OER) and hydrogen evolution reaction (HER), which is conducive to satisfy the electrochromic reactions of the WO3 layer at high potentials and effectively improve the electrochemical stability.
Figure 1
Figure 1.
(a) LSV curves with different concentrations of LiCl. (b) Coordination numbers of Li-O and Li-Cl. (c) Free water molecule and coordination water contents in different concentrations of LiCl. (d, e) Schematic representation of the solvated structures of 1 mol/L and 20 mol/kg LiCl. (f) Ionic conductivity of 1 mol/L LiCl, 20 mol/kg LiCl and 1 mol/L LiClO4 at 25 ℃.
Molecular dynamics (MD) simulations were employed to investigate the structure and kinetic properties of hydration systems at different LiCl concentrations (1 mol/L, 5 mol/kg, 10 mol/kg, 15 mol/kg, and 20 mol/kg) (Fig. S2 in Supporting information). Due to the small size and high charge density of Li+, they usually exhibit strong interactions with the surrounding H2O molecules [24], resulting in the formation of rigid hydration spheres, as evidenced by the appearance of the Li+-O sharp peak at 0.196 nm. Whereas, the spike located at 0.243 nm is attributed to Li+-Cl- interaction (Fig. S3 in Supporting information) [25,26]. The lithium hydration sphere is balanced between four stabilizing clusters: [Li+(H2O)4]+, [Li+(H2O)3Cl-], [Li+(H2O)2(Cl-)2]-, and [Li+(H2O)(Cl-)3]2- (Fig. S4 in Supporting information), and the total coordination number of lithium ions remains approximately 4 at different salt concentrations (Fig. 1b). With increasing salt concentration, Li+-Cl- interaction intensifies as more Cl- penetrates the lithium hydration sphere and replaces partial H2O molecules, leading to a decrease in the Li+-O coordination number [27-31]. Further analysis of the simulations showed that the percentage of free water in 20 mol/kg LiCl WiSE was only 5.7%, whereas in 1 mol/L, 5 mol/kg, 10 mol/kg, 15 mol/kg LiCl, it was 83.2%, 40.5%, 15.6%, and 9.5%, respectively (Fig. 1c). The reduction in free water molecules implies that the proton activity is affected by the salt concentration. At low concentrations, a small amount of lithium hydration shells is evenly distributed, and the proton activity still favors the side reactions of electrolytic water, as there are sufficient free H2O molecules available (Fig. 1d). With further increasing LiCl concentration, Cl- ions penetrate the lithium hydration spheres to substitute for partial H2O molecules, resulting in limited free H2O availability (Fig. 1e). This significantly diminishes the proton supply and contributes to enhanced electrochemical stability under both room temperature and even extreme temperature conditions. Therefore, high-concentration salt electrolytes can effectively improve electrochemical stability. Raman spectroscopy was utilized to investigate the structural evolution of LiCl electrolytes as their concentration increased. The Raman bands ranging from 2800 cm-1 to 3800 cm-1 correspond to the O—H stretching vibration modes of water molecules (Fig. S5 in Supporting information). In a dilute solution (1 mol/L LiCl), the O—H stretching vibrations display broad Raman bands similar to those observed in pure water. These bands are ascribed to five hydrogen-bonding environments: DAA (single-donor-double-acceptor), DDAA (double-donor-double-acceptor), DA (single-donor-single-acceptor), DDA (double-donor-double-acceptor) donor-single-acceptor), and free-OH in the free water clusters [32,33]. As the concentration increased, the presence of free-OH significantly decreases in 20 mol/kg LiCl solution, indicating a greater involvement of H2O molecules in the lithium hydration sphere, thereby significantly reducing proton availability. This observation aligns with the widening of the electrochemical stability window observed in 20 mol/kg LiCl solution.
The ionic conductivity (σ, S/cm) was obtained from impedance tests, for specific details refer to the section on electrochemical measurements (Figs. S6-S8, Tables S1 and S2 in Supporting information). The 1 mol/L LiCl solution demonstrates a high conductivity of up to 43.2 mS/cm. Ionic conductivity is influenced by ion concentration and ion mobility. With increasing ion concentration, the distance between ion dimini ishes, leading to stronger interactions and heightened resistance to ion movement. On the other hand, in the 20 mol/kg LiCl electrolyte, the electrostatic interaction between electronegative Cl- channels and the electropositive hydrated lithium ions facilitates efficiention transport in the WiSE (Fig. S8 in Supporting information) [34,35]. Ultimately, the ionic conductivity of the 20 mol/kg LiCl electrolyte reaches 60.7 mS/cm, significantly surpassing that of 1 mol/L LiClO4 in PC (the commonly used organic electrolyte), which stands at 6.2 mS/cm (Fig. 1f). It is noteworthy that the use of concentrated or saturated salt solutions in water can significantly depress the freezing point to well below the thermodynamic value. As shown in Fig. S9 (Supporting information), the differential scanning calorimetry (DSC) results reveal that the freezing point of 1 mol/L LiCl is −5.4 ℃. When the concentration is further increased to 20 mol/kg, the freezing point drops to −30.7 ℃, ensuring the device’s operability under low-temperature conditions. In addition, the conductivity of 1 mol/L LiCl and 20 mol/kg LiCl at different temperatures was plotted (Fig. S10 in Supporting information), based on the internal resistance obtained from the Nyquist plots (Figs. S11 and S12 in Supporting information). The calculation results show that at −30 ℃, the conductivity of 20 m LiCl decreases more significantly, but it still remains at 11.9 mS/cm, which meets the requirements for ECDs. Under the condition that the low-temperature conductivity supports the normal operation of the device, the electrolyte’s ability to maintain stable optical transmittance without being affected by freezing becomes even more crucial. Furthermore, the ionic conductivity at different temperatures was fitted using the Vogel-Tamman-Fulcher (VTF) empirical formula [36]:
σ=AT−12[−EaR(T−T0)]
(1)
where A represents the pre-exponential factor, Ea denotes the activation energy, R stands for the ideal gas constant, and T0 denotes the ideal glass transition temperature. Ea can be approximated as the desolvation energy barrier for Li+. According to this equation, the Ea for 20 mol/kg LiCl is 0.10 eV, which is lower than the Ea for 1 mol/L LiCl (0.17 eV). The root cause of this difference lies in the distinct solvation effects of Li+ in the two solutions [37]. As a result, 20 mol/kg LiCl is more favorable for the electrochemical insertion/extraction of Li+ ions.
The aforementioned results indicate that the 20 mol/kg LiCl WiSE boasts a wide electrochemical stability window, high ion conductivity, and extensive temperature tolerance. Therefore, the utilization of 20 mol/kg LiCl WiSE holds promise for fabricating high performance ECDs applicable under extreme temperature environents. In this study, we employed magnetron sputtered tungsten oxide (WO3) as the electrochromic active layer, graphite foil as the ion storage layer, and 20 mol/kg LiCl WiSE as the electrolyte to construct the ECD (Fig. 2a). WO3 is the most widely used inorganic electrochromic material, known for its high modulation efficiency, rapid response, and excellent cyclic stability [38,39]. Magnetron sputtering offers the advantages of good uniformity and high reproducibility [40]. Therefore, in this study, magnetron–sputtered WO3 was chosen as the electrochromic active material (Fig. S13a in Supporting information). Magnetron-sputtered WO3 typically possesses an amorphous structure (Fig. S13b in Supporting information), resulting in faster response speeds as they bypass a slow phase transition process [41]. SEM imaging showed that the amorphous WO3 consisted of particles approximately 200 nm in size, forming a film with numerous gaps and interstitials in its microscopic structure (Fig. S13c in Supporting information), facilitating the conduction of electrolyte ions. To enhance the credibility of the experimental results, the thickness of the WO3 films used in this study was uniformly set to 300 nm (Fig. S13d in Supporting information). Graphite foil, characterized by its affordability, high conductivity, plasticity, remarkable chemical stability and rich surface chemistry, was chosen as the ion storage layer. Importantly, it can be effectively combined with other materials such as metal and glass to fulfill the diverse design requirements of ECDs [42]. XRD analysis of the graphite foil revealed only a narrow and sharp characteristic peak at 26.7° corresponding to the (002) crystal plane (Fig. S14a in Supporting information), consistent with the characterization card of graphite (JCPDS No. 41–1487), indicating a high degree of graphitization of the graphite foil [43]. The optical image showing the appearance of graphite was depicted in Fig. S14b (Supporting information), and SEM results illustrated the presence of stacked layers of graphite within the graphite foil (Fig S14c in Supporting information).
Figure 2
Figure 2.
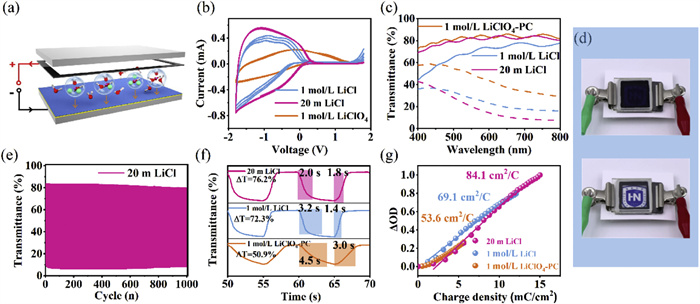
(a) Schematic of electrochromic device assembled from tungsten trioxide and graphite foil. (b) CV curves of electrochromic devices in different electrolytes. (c) Transmission spectra in the visible range. (d) Photographs of electrochromic device (3 cm × 3 cm) in coloring and bleaching states. (e) Cyclic stability of 20 mol/kg LiCl @700 nm transmittance. (f) Switching time @700 nm. (g) Variation of optical density (ΔOD, 633 nm) versus charge density of WO3 membrane in different electrolytes.
To validate the superiority of 20 mol/kg LiCl WiSE, ECDs with different electrolytes were assembled, where the electrochemical and EC properties were studied and compared. For the ECDs using 20 mol/kg LiCl and 1 mol/L LiClO4-PC, the CV curves for the first three cycles largely overlapped, whereas non-overlapping CV curves were obtained for the device with 1 mol/L LiCl, demonstrating the high electrochemical reversibility of the devices utilizing 20 mol/kg LiCl and 1 mol/L LiClO4-PC electrolytes (Fig. 2b). Additionally, the device using 1 mol/L LiClO4-PC exhibited a smaller enclosed area in the CV curve which could be attributed to lower ionic conductivity, resulting in a slower Li+ insertion/extraction process. Conversely, the device utilizing 20 mol/kg LiCl WiSE exhibited the largest CV curve area, demonstrating the highest electrochemical activity. Optical modulation, cyclic stability, response time, etc., are the most critical evaluation parameters for ECDs. Fig. 2c shows transmission spectra measurements at −1.8 V (colored state) and 1.8 V (bleached state). The ECD with 20 mol/kg LiCl WiSE demonstrates outstanding optical modulation, with a modulation rate of 76.2% at the wavelength of 700 nm, surpassing that of devices using 1 mol/L LiCl (72.3%) and far exceeding that of the device employing the commonly used 1 mol/L LiClO4-PC (50.9%). Fig. S15 (Supporting information) shows the solar irradiance transmittance spectra for devices using three different electrolytes, with the corresponding calculated results provided in Table S3. The ECD constructed with the 20 mol/kg LiCl electrolyte exhibits a solar radiation transmission modulation of 61.0%, which is higher than that of devices using 1 mol/L LiCl (43.5%) and 1 mol/L LiClO4 (37.4%). Fig. 2d illustrates the optical images of the electrochromic device assembled with 20 mol/kg LiCl WiSE in the colored and bleached states, displaying a uniform dark blue color in the colored stateand clear visibility in the bleached state, driven by the reversible insertion/extraction of lithium ions into the WO3. XPS characterization was conducted on WO3 in the initial and colored state, respectively (Fig. S16 in Supporting information). Compared to the initial state, a portion of W6+ in WO3 was reduced to W5+ in the colored state, consistent with that in the common LiClO4-PC system [44,45].
The presence of H2O in the 20 mol/kg LiCl WiSE primarily participates in the form of lithium hydration spheres, characteried by very few free H2O molecules, with significantly reduced proton supply and minimized dissolution of the electrochromic material. Consequently, the ECD using 20 mol/kg LiCl WiSE exhibits significantly improved cyclic stability. After 1000 coloring/bleaching cycles, the optical modulation remains 95.8% of the initial value (Fig. 2e), comparable to the stability achieved with organic electrolyte based on 1 mol/L LiClO4-PC (Fig. S17 in Supporting information). In contrast, due to the abundance of free water molecules, severe water decomposition occurs as side reactions in 1 mol/L LiCl electrolyte. Consequently, the WO3 layer in devices using 1 mol/L LiCl electrolyte corrodes and fails after several tens of coloring/bleaching cycles, resulting in a significant deterioration of optical modulation till disappearance (Fig. S18 in Supporting information). Despite the favorable stability of the LiClO4-PC electrolyte, the optical modulation was significantly lower than that of 20 mol/kg LiCl WiSE in the same coloring voltage range, attributed to its low ionic conductivity. The electrochemical cycling stability, corresponding to the spectral stability, is depicted in Figs. S19-S21 (Supporting information), where a sudden drop in current occurred after approximately sixty cycles in the 1 mol/L LiCl electrolyte, resulting in the expired coloration of WO3. In contrast, the maximum current intensity of ECDs with the 20 mol/kg LiCl WiSE and the 1 mol/L LiClO4 electrolyte maintained nearly constant throughout the coloring and bleaching processes.
The response time is defined as the time required to achieve 90% of the required optical modulation during coloring or bleaching process. As depicted in Fig. 2f, the coloring/bleaching times for electrochromic devices using 20 mol/kg LiCl are 2.0/1.8 s, which are shorter compared to those using 1 mol/L LiCl (3.2/1.4 s) and 1 mol/L LiClO4-PC (4.5/3.0 s) electrolytes. The device employing 20 mol/kg LiCl electrolyte exhibits a faster response, which is associated with its higher ionic conductivity. The coloration efficiency (CE) is also an important parameter for evaluating ECDs. Defined as the change in optical density (∆OD) per unit of inserted charge (∆Q). CE can be calculated by the following equation [46]:
CE=ΔODΔQ=log(TbTc)/ΔQ
(2)
where Tb and Tc are the corresponding transmittance in the bleached and colored states, respectively. ∆Q is obtained by integrating the curve current of the chronoamperometer. The calculated CE of the device assembled with 20 mol/kg LiCl WiSE is 84.1 cm2/C, which is significantly higher than that with 1 mol/L LiCl (69.1 cm2/C) and 1 mol/L LiCl (53.6 cm2/C) (Fig. 2g). Table S4 (Supporting information) lists the performance metrics of the reported tungsten oxide-based ECDs with different electrolytes. It can be observed that our ECDs utilizing LiCl WiSE exhibit significant competitiveness.
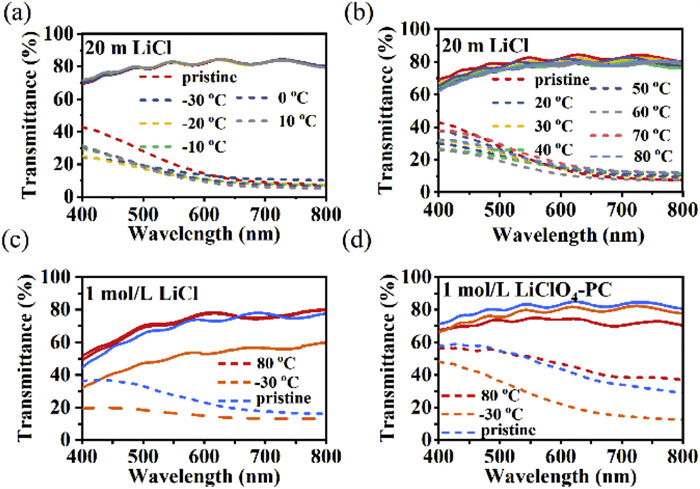
As commonly known, ECDs primarily operate in both indoor and outdoor environments, where they are inevitably exposed to seasonal variations or regional temperature fluctuations. Therefore, they must possess excellent environmental tolerance to ensure their applicability and stability. For example, in cold regions, the temperature can drop below −30 ℃ in winter, while in tropical regions, the surface temperature of the device may rise to 80 ℃ in summer due to solar radiation. Hence, achieving efficient ECDs necessitates electrolytes with both high-temperature and low-temperature tolerance. To assess the tolerance of devices using 20 mol/kg LiCl WiSE toward extreme temperatures, we subjected them to 100 coloring/bleaching cycles in an oven set at different temperatures, followed by optical modulation testing. Experimental results, as shown in Figs. 3a and b, reveal no significant degradation in optical modulation of the ECD after 100 cycles of coloring/bleaching cycles within the temperature span of −30~80 ℃. The transmittance curves of the ECD in both the colored and bleached states across all temperature ranges appear similar, as the degree of coloration is primarily influenced by the redox state of tungsten oxide. This demonstrates that the devices exhibit excellent electrochromic functionality across different temperatures. Fig. S22 (Supporting information) summarizes the optical modulation at 700 nm wavelength after cycling at different temperatures (−30~80 ℃), yielding optical modulation of 71.8%, 74.4%, 74.5%, 75.1%, 76.3%, 69.1%, 70.6%, 66.9%, 71.8%, 69.4%, 65.2%, and 65.6%, respectively. The device exhibited acceptable optical modulation after cycling at all temperatures. Fig. S23-S25 (Supporting information) depict the electrochemical curves during coloring/bleaching cycles at different temperatures, and no significant attenuation can be observed in the maximum current all curves, further confirming the device’s wide temperature tolerance. Furthermore, we also tested the response time and coloration efficiency of the devices at −30 ℃ and 80 ℃. The response times of the devices at −30 ℃ and 80 ℃ were 5.5/6.5 s and 1.5/1.3 s, respectively (Figs. S26a and b in Supporting information). It can be seen that even at −30 ℃, the ECD utilizing 20 mol/kg LiCl WiSE still exhibits competitive response speeds. The coloring efficiencies of the devices at −30 ℃ and 80 ℃ were calculated to be 80.0 and 86.1 cm2/C, respectively (Figs. S26c and d in Supporting information), maintaining similar levels to those at room temperature. This indicates that the ECD assembled with 20 mol/kg LiCl as the electrolyte achieves large optical modulation with low energy consumption, offering promising prospects for various applications. As a comparison, the performances of ECDs using 1 mol/L LiCl and 1 mol/L LiClO4-PC electrolytes under extreme temperatures were also explored. At low temperatures, the ion migration rate of 1 mol/L LiCl is slow, resulting in lower current density in the ECD (Fig. S23 in Supporting information), with an optical modulation of only 43.2% after 100 cycles (Fig. 3c). Conversely, at high temperatures, the ECD using 1 mol/L LiCl electrolyte exhibits haphazard and irregular current behavior, primarily due to the occurrence of severe water decomposition side reactions caused by the presence of abundant free water molecules. After 100 cycles at 80 ℃, the optical modulation of the devices using 1 mol/L LiCl electrolyte is only 0.5%. Although the ECD using 1 mol/L LiClO4-PC electrolyte maintains stability at both high and low temperatures, the optical modulation at −30 ℃ and 80 ℃ are 65.4% and 31.7%, respectively. Therefore, under extreme temperatures, the optical modulation of the ECD using 1 mol/L LiClO4-PC is significantly lower than that of 20 mol/kg LiCl electrolyte (Fig. 3d).
Figure 3
Figure 3.
(a) Low-temperature and (b) high-temperature optical performance of electrochromic devices with 20 mol/kg LiCl recorded in the visible range. Optical modulation curves of the device with (c) 1 mol/L LiCl and (d) 1 mol/L LiClO4 at −30 ℃ and 80 ℃ (@700 nm).
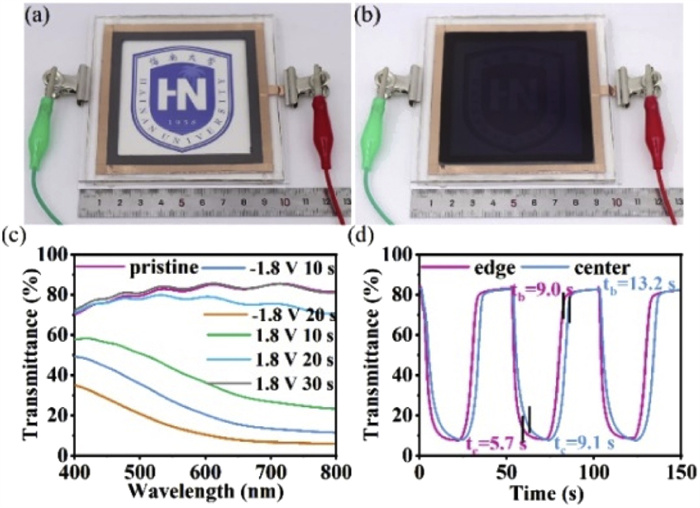
It is also a long-standing challenge for ECDs to achieve uniform modulation over large area regions. In this study, a large-area window (10 cm × 10 cm) using 20 mol/kg LiCl WiSE as the electrolyte was constructed to demonstrate the scalability of the electrochromic smart window platform. Figs. 4a and b shows the optical images of the device in the colored and bleached state. In the colored state, the transmittance of the device at 700 nm is only 7.7%, while the transmittance reaches 84.2% in the bleached state (Fig. 4c). Due to the resistive induced voltage drop on the conductive glass, the respond time at different locations (center and edges) of the large-area window is different [47]. Fig. 4d shows that the coloring time at the edges and center of the ECD is 5.7 s and 9.0 s, respectively. While the bleaching time is 9.1 s and 13.2 s, respectively. The relatively short coloring and bleaching times confirm that the 10 cm × 10 cm device using 20 mol/kg LiCl WiSE as the electrolyte has a fast and uniform modulation capability.
Figure 4
Figure 4.
(a, b) Exhibition pictures of and faded colored performance of ECD with a 10 × 10 cm2 area. (c) Transmission spectra in the visible range. (d) Comparison in optical transmittance of colored and faded states at the edge/center of the ECD at 700 nm.
In summary, we have constructed a stable WO3-graphite foil electrochromic system based on a 20 mol/kg LiCl WISE. The limited free H2O molecules in the WiSE reduce the proton supply, which significantly widens the electrochemical window and enhances the electrochemical stability. In addition, electrostatic interactions between electronegative Cl- channels and electropositive hydrated Li-ions facilitate efficient transport of hydrated Li-ions within the WiSE. As a result, the ECD using 20 mol/kg LiCl WiSE not only achieves large optical modulation, fast response time, and high cycling stability at ambient temperature, but also operates efficiently across a wide temperature range from −30 ℃ to 80 ℃. This research paves the way for the development of high-performance, all-temperature-tolerant ECDs.
Declaration of competing interest
The authors declare that they have no known competing financial interests or personal relationships that could have appeared to influence the work reported in this paper.
The high-performance computing resources in this work are available partially from Beijing PARATERA Technology Co., Ltd. And this work is also financially supported by the National Natural Science Foundation of China (Nos. 52102359, 62305093, 52172299 and 52462040), Hainan Provincial Natural Science Foundation of China (No. 124RC438). Hainan Province “Nanhai New Star” Science and Technology Innovation Talent Platform Program (No. NHXXRCXM202304). S. Cong would like to acknowledge the support from the External Cooperation Program of the Chinese Academy of Sciences (No. 320GJHZ2023011MI), Suzhou Industrial Science and Technology Program (No. SYC2022036), and High-end Talents Program of Jiangxi Province (No. jxsq2023101113).
Supplementary materials
Supplementary material associated with this article can be found, in the online version, at doi:10.1016/j.cclet.2025.110824.
Z. Wang, W. Gong, X. Wang, et al., ACS Appl. Mater. Interfaces 12 (2020) 33917–33925. doi: 10.1021/acsami.0c08270
[47]
H. Li, W. Zhang, A.Y. Elezzabi, Adv. Mater. 32 (2020) 2003574. doi: 10.1002/adma.202003574
Figure 1
(a) LSV curves with different concentrations of LiCl. (b) Coordination numbers of Li-O and Li-Cl. (c) Free water molecule and coordination water contents in different concentrations of LiCl. (d, e) Schematic representation of the solvated structures of 1 mol/L and 20 mol/kg LiCl. (f) Ionic conductivity of 1 mol/L LiCl, 20 mol/kg LiCl and 1 mol/L LiClO4 at 25 ℃.
Figure 2
(a) Schematic of electrochromic device assembled from tungsten trioxide and graphite foil. (b) CV curves of electrochromic devices in different electrolytes. (c) Transmission spectra in the visible range. (d) Photographs of electrochromic device (3 cm × 3 cm) in coloring and bleaching states. (e) Cyclic stability of 20 mol/kg LiCl @700 nm transmittance. (f) Switching time @700 nm. (g) Variation of optical density (ΔOD, 633 nm) versus charge density of WO3 membrane in different electrolytes.
Figure 3
(a) Low-temperature and (b) high-temperature optical performance of electrochromic devices with 20 mol/kg LiCl recorded in the visible range. Optical modulation curves of the device with (c) 1 mol/L LiCl and (d) 1 mol/L LiClO4 at −30 ℃ and 80 ℃ (@700 nm).
Figure 4
(a, b) Exhibition pictures of and faded colored performance of ECD with a 10 × 10 cm2 area. (c) Transmission spectra in the visible range. (d) Comparison in optical transmittance of colored and faded states at the edge/center of the ECD at 700 nm.

 DownLoad:

 下载:
下载:


 下载:
下载:
