College of Mechanical & Electrical Engineering, Shaanxi University of Science and Technology, Xi’an 710021, China
b.
Shaanxi Key Laboratory of Green Preparation and Functionalization for Inorganic Materials, School of Material Science and Engineering, Shaanxi University of Science and Technology, Xi’an 710021, China
c.
Division of Physics and Applied Physics, School of Physical and Mathematical Sciences, Nanyang Technological University, Singapore 637371, Singapore
Received Date:
16 October 2024 Accepted Date:
20 December 2024 Revised Date:
13 December 2024 Available Online:
15 April 2026
Abstract:
Alkali metal-ion batteries, such as lithium-ion and sodium-ion batteries, have been widely recognized by both academia and industry for their high energy density, long cycle life, low self-discharge rate, and environmental friendliness. Theoretical calculations are crucial in elucidating the energy storage mechanism of alkali metal-ion batteries and in designing the next generation of high-performance energy storage systems. This article reviews the application of theoretical calculations in alkali metal-ion batteries. These calculations are instrumental for experimental researchers in understanding the microscopic design of electrode materials, optimizing various interfaces and electrolyte structures, and clarifying ion and electron transport behaviors as well as electrochemical reaction mechanisms. Specifically, researchers typically calculate the reduction reactions, charge state changes, and structural changes of cathode materials to predict their electrochemical reactivity and optimize their performance and stability. Calculations and simulations of alkali metal batteries focus on ion transport dynamics within the electrolyte, including energy level distribution, solvation structure, and molecular dynamics simulations. Analyzing oxidation reactions, ion diffusion, and volume changes in various alkali metal-ion battery anode materials enables the screening and design of new anode materials with superior electrochemical properties. This review also discusses the challenges of applying theoretical calculations in alkali metal-ion batteries and provides an outlook for future research. Critical insights are offered for advancing research paradigms that integrate theoretical and experimental approaches in the development of energy storage electrode materials.
As fossil fuel resources continue to deplete, research on renewable energy has become increasingly important over the past few decades [1]. Consequently, energy storage systems have garnered significant attention across various fields [2-4]. In energy storage systems, rechargeable lithium-ion batteries (LIBs) have been widely commercialized due to their environmental friendliness, high energy density, and other advantageous properties [5-10]. Similarly, sodium-ion batteries (SIBs) [11-14] and potassium-ion batteries (PIBs) [15-18] have also attracted growing interest from academia and industry, owing to their abundant resources and low cost. However, in the field of alkali metal batteries, cathode materials encounter significant electrochemical challenges, including energy density, conductivity, cycle stability, and interface stability during the charge and discharge cycles. Additionally, the phase change behavior of these materials requires thorough investigation [19,20]. Electrolytes present challenges such as ion migration mechanisms, thermodynamic stability, and interfacial interactions with electrode materials [21,22]. Anode materials face electrochemical challenges including ion intercalation and deintercalation, as well as dendrite formation and growth during energy storage [23]. Therefore, researchers are dedicated to elucidating the energy storage mechanisms of alkali metal ion batteries and developing higher-performance electrode materials and innovative energy storage device technologies.
To enhance the understanding of energy storage mechanisms in electrochemical devices, theoretical calculations have been widely applied in the energy storage field in recent years [24-28]. The accuracy of theoretical calculations depends on the selection of the exchange-correlation (XC) functional. Commonly used functionals include the local spin density approximation (LSDA), generalized gradient approximation (GGA), and HSE06 hybrid functional. LSDA is considered the first-generation functional. Its advantage lies in its notable performance in predicting lattice constants. Nevertheless, its drawbacks include significantly underestimating the barrier heights of chemical reactions and excessively binding chemical bonds [28,29]. The GGA functional has been shown to provide a more accurate description of energy and structure than the local density approximation (LDA). It usually calculates semiconductor band gap values that more closely align with experimental values compared to those obtained with LDA. Conversely, it still underestimates the band gaps, barrier heights, and non-covalent interactions of materials [28,30]. LDA and GGA calculations generally result in highest occupied molecular orbital-lowest unoccupied molecular orbital (HOMO-LUMO) energy gaps, whereas Hartree-Fock calculations typically produce excessively large energy gaps. Hybrid functionals combines these two methods to provide more detailed computations. For example, the commonly used HSE06 hybrid functional delivers a more reliable calculation of the electronic structure of solid materials. On the contrary, the use of the HSE06 hybrid functional results in significantly increased computational effort and cost [28,31]. Accordingly, given the computational cost and effort, the primary functional used in battery materials science is the GGA functional. In particular, the Perdew-Burke-Ernzerhof (PBE) functional within GGA is commonly used to simulate the structure and elucidate the activity of energy storage electrode materials [32-34]. To compensate for this deficiency, the following discussion will focus on some more advanced computational methods and techniques that can more effectively combine theoretical calculations with experimental data to provide a more comprehensive analysis of battery material performance.
Currently, theoretical calculations for energy storage electrode materials primarily encompass the following aspects: material crystal structure, band structure (BS) and density of states (DOS), differential charge density, Bader charge (BC), adsorption energy (Eads), dissociation energy, diffusion barriers, average open-circuit voltage, solvation structure, electrostatic potential (ESP), LUMO and HOMO, and the ion diffusion kinetics. In contrast, in most studies, the focus is primarily on experimental exploration, with theoretical calculations primarily serving as a supplementary tool to validate experiments [35-38]. Some studies use theoretical calculations for a comprehensive analysis of battery materials but often lack integration with experimental and practical applications [39-41]. Very few studies balance both experimental methods and theoretical calculations equally [42,43].
In recent years, significant progress has been achieved in applying theoretical calculations to energy storage systems, including alkali metal ion batteries. Theoretical calculations have become essential tools for a comprehensive understanding of the microscopic mechanisms in energy storage materials, particularly in examining redox reactions, charge density variations, electron transport characteristics, interface reactions, and ion migration behaviors in electrode materials and electrolytes. This article aims to systematically review the key applications of theoretical calculations in energy storage devices, with a particular focus on the research progress of cathode materials, anode materials, and electrolytes. Additionally, this article will discuss the necessity of integrating theoretical calculations with experimental research, analyze how this integration can better elucidate the actual performance of materials, and anticipate the challenges and opportunities that may arise in future development.
2.
Applications of theoretical calculations in the study of cathode materials for alkali metal batteries
2.1
Electronic structure calculation of cathode materials
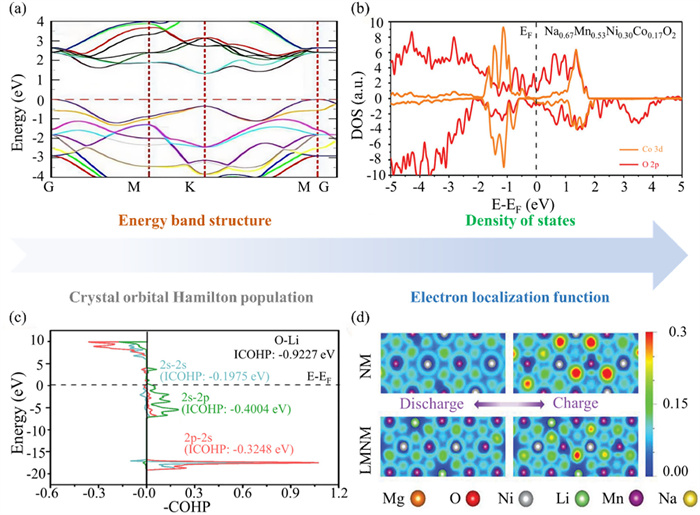
The energy level structure and charge distribution of cathode materials are critical aspects in understanding their performance and optimizing their design. Furthermore, density functional theory (DFT) is commonly used to calculate the electronic structure, providing valuable insights into the material’s behavior at the atomic and electronic levels [44]. These include calculations of the BS, DOS, electron localization function (ELF), and crystal orbital Hamilton population (COHP). Among these, the BS is employed to elucidate the material’s conductivity and semiconductor properties (Fig. 1a) [45]. In Fig. 1b, the DOS aids in understanding the distribution of electrons at different energy levels, particularly around the Fermi level [46]. A smaller ∆Eg in the BS and DOS shows enhanced electronic conductivity. Cathode materials with high conductivity can effectively transfer electrons and maintain battery stability, thereby improving the discharge efficiency and power density of the battery [47,48].
Figure 1
Figure 1.
Calculation of energy level structure. (a) Energy band diagrams of MoS2. Reproduced with permission [45]. Copyright 2023, Elsevier. (b) The DOS of Na0.67Mn0.53Ni0.30Co0.17O2. Reproduced with permission [46]. Copyright 2023, Wiley-VCH Verlag. (c) The COHP analyses on O-Li. Reproduced with permission [49]. Copyright 2024, Elsevier. (d) Electronic localization function map of NM system and LMNM system [50]. Reproduced with permission [50]. Copyright 2023, Wiley-VCH Verlag.
As shown in Fig. 1c, COHP computational analysis can provide information about the nature of chemical bonds, such as the polarity, covalency, and ionicity of the bonds [49]. Bonding and antibonding interactions are described by the contribution of different energy levels in the energy band. Bonding interactions usually have negative COHP values. These negative values indicate orbital overlap and favor the formation of chemical bonds, reflecting the material’s stability. Antibonding interactions generally correspond to positive COHP values. These positive values exhibit reverse overlap between orbitals that may weaken the stability of the chemical bond. The stability of chemical bonds directly affects the structural stability of battery materials. Strong bonding interactions usually result in a more stable material structure, while weak chemical bonds may cause structural changes or degradation of the material during battery charging and discharging.
The electron localization function (ELF) can reveal the degree of localization of electrons in the electrode material, thereby inferring the possible structural changes and stability of the material during the charge and discharge process (Fig. 1d) [50]. For instance, high ELF values may indicate a material with strong electron localization and higher structural stability. In consequence, analyzing the electronic structure provides insights into electron localization, which explains the material’s stability, conductivity, and electrochemical performance. Combining computational and experimental results allows for a more comprehensive understanding and optimization of battery material performance.
DFT calculations of charge density distribution include methods such as 3D differential charge density, BC, and ESP. These methods not only facilitate a comprehensive understanding of the electrochemical reaction mechanisms of materials and the prediction and optimization of electrochemical performance, but also support materials design and modification, analyze electrode-electrolyte interface effects, and guide experimental design. Furthermore, it elucidates potential failure mechanisms that may arise during use, thereby offering pivotal theoretical support and guidance for the development of high-performance and long-life batteries.
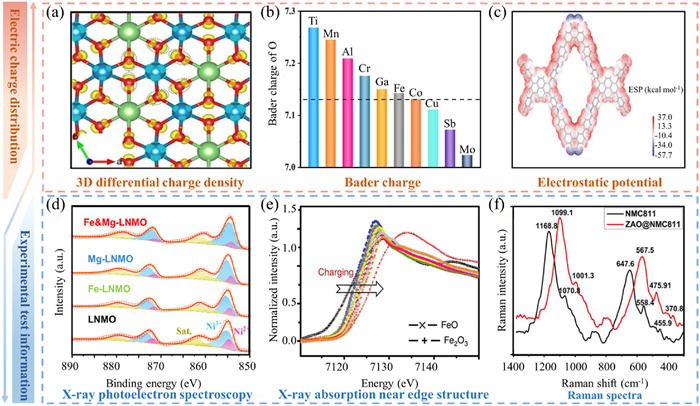
3D differential charge density is used to analyze charge transfer and bonding characteristics, revealing the charge distribution within the material and at interfaces through changes in charge density (Fig. 2a) [51]. BC analysis provides information on the charge state and charge transfer of each atom, quantitatively describing the charge distribution within the material, thus aiding in the understanding of reaction mechanisms and optimizing material performance (Fig. 2b) [52]. Both 3D differential charge density and BC analysis facilitate the understanding of the electronic transport properties of electrode materials and the interactions between cathode materials and electrolytes. By analyzing ESP, the charge densities of atoms or atomic groups in cathode materials can be determined (Fig. 2c) [53]. These regions typically correspond to the active sites in the material, which may play a key catalytic role in the battery, thereby facilitating redox reactions.
Figure 2
Figure 2.
Calculation and experiment of electronic structure. (a) Charge density difference of NLMO. Reproduced with permission [51]. Copyright 2024, Royal Society of Chemistry. (b) BC of O in various TM-O6 configuration. Reproduced with permission [52]. Copyright 2024, Wiley-VCH Verlag. (c) Molecular electrostatic potential (MESP) map of BFPPQ-COF repetitive units showing possible active sites [53]. Reproduced with permission [53]. Copyright 2023, Wiley-VCH Verlag. (d) XPS spectra and the high-resolution of Ni 2p. Reproduced with permission [49]. Copyright 2024, Elsevier. (e) corresponding synchrotron Fe K-edge XANES during charging. Reproduced with permission [56]. Copyright 2023, Royal Society of Chemistry. (f) Raman spectroscopy of NMC811 and ZAO@NMC811 [57]. Copyright 2023, Elsevier.
In summary, the energy level structure and charge density distribution are key parameters in electrode material calculations. They are validated by experimental techniques including X-ray photoelectron spectroscopy (XPS) [49,54,55], X-ray absorption near-edge structure (XANES) [56], and Raman spectroscopy [54,57].
Chemical shift in XPS refers to the change in the binding energy of an element relative to a standard reference. Chemical shifts reflect changes in the chemical environment of an element, such as changes in valence state or coordination environment (Fig. 2d) [49]. Electronic structure calculations can provide the electron orbital distribution (such as the electron distribution of d orbital or s orbital) and electron density distribution of elements in different valence states. The reasons for this experimental variation can be explained by comparing the calculated coordination environments with the chemical shifts observed in XPS.
As illustrated in Fig. 2e, the position of the absorption edge in the XANES spectrum (i.e., the initial point of the absorption peak) provides information on the valence state and chemical environment of the element. The energy position of the absorption edge depends on the chemical state of the element and the local environment [56]. Electronic structure calculations can predict the binding energy and DOS of an element in different valence states. As a consequence, by calculating the characteristics of the XANES spectral lines, the position of the absorption edge can be simulated and compared with the calculated results. In Fig. 2f, Raman spectroscopy reveals molecular vibrations and lattice dynamics while variations in Raman-active modes indirectly indicate changes in the energy level structure. Variations in charge density influence the vibrational modes of molecules, which are observed as changes in peak position, intensity, and shape in the Raman spectrum [54,57]. Therefore, the theoretical calculation results can be used to explain the local structural features observed in the Raman spectra.
As discussed in the review, integrating theoretical calculations with experimental tests enhances our understanding of the electronic properties and reaction mechanisms of materials. Theoretical calculations offer detailed insights into the internal mechanisms of materials, whereas experimental tests reveal the behavior of materials under actual conditions, including chemical valence and local environment. By integrating these approaches, a more comprehensive understanding can be attained, uncovering the true behavior and performance of materials.
2.2
Ion migration calculation
For cathode materials in alkali metal-ion batteries, factors such as long-cycle stability, charge transfer efficiency, charge and discharge rates, and ionic conductivity must be considered. Consequently, DFT is utilized to determine parameters such as Eads, bond length (BL), dissociation energy, diffusion pathway, and diffusion barrier of cathode materials, thereby assessing the interface stability, ion transport characteristics, and cycling performance of the materials. As a quantum mechanical modeling method, DFT facilitates the computation of these parameters through the simulation of the electronic structure of materials. This establishes a theoretical foundation for deciphering the fundamental mechanisms of electrochemical reactions and delivers insights for the design and enhancement of high-performance alkali metal ion batteries [44,55,58-60]. This provides guidance for designing and optimizing high-performance alkali metal-ion batteries.
The Eads refers to the interaction energy between the cathode material and ions or molecules in the electrolyte. The formula for the Eads of Li+, Na+, and K+ on the cathode material is defined as [58]:
Eads=EAMn−EA−nEM
(1)
where EAMn is the total energy of the metal ion adsorbed on the single layer of material A, EA is the energy of the original material A, M is the energy of a single metal ion calculated from the corresponding bulk phase, and n is the number of metal ions adsorbed on each A.
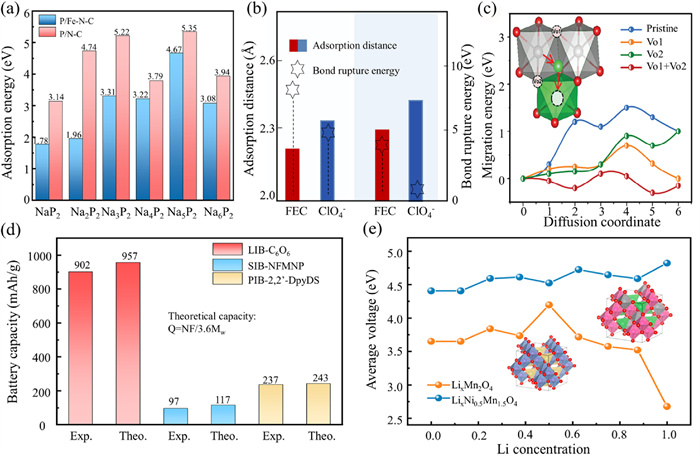
A higher Eads exhibits stronger adsorption of ions or molecules by the material, which helps improve the interface stability and charge transfer efficiency between the material and the electrolyte (Fig. 3a) [59]. Dissociation energy, BL, and other related parameters are important for assessing the reduction stability, reactivity, and structural properties of cathode materials with the electrolyte. Shorter BL and higher dissociation energies indicate better stability of the material towards reactants, which is beneficial for improving the cycle stability of the material, as shown in Fig. 3b [60]. The diffusion barrier refers to the energy barrier that needs to be overcome when ions diffuse in the cathode material (Fig. 3c). The low ion diffusion barrier means that alkali metal ions can move more easily and quickly within the electrode material. The faster ion diffusion speed allows the battery to still provide sufficient charge supply at high rates. It follows that, the low potential barrier for ion diffusion helps improve the rate performance [55,61].
Figure 3
Figure 3.
Ion migration calculations, theoretical capacity and average open circuit voltage calculations. (a) Ion migration calculations. Differential charge densities of FEC-P/Fe-N-C and FEC-P/N—C and Eb C-F bonds in FEC. Reproduced with permission [59]. Copyright 2024, Wiley-VCH Verlag. (b) Interfacial adsorption and decomposed behaviors of electrolyte components (FEC and ClO4-) on different cathode crystal planes with corresponding adsorption distances and bond rupture energies [60]. Copyright 2023, Springer Nature. (c) The migration energy for Ni to diffuse from the TM layer to Li layer, under different situations. Reproduced with permission [55]. Copyright 2023, Wiley-VCH Verlag. (d) Theoretical capacity and actual capacity of cathode materials in alkali metal batteries [43,64,65]. (e) Variation of average intercalation voltage of spinel-type LiMn2O4 and spinel-type LiNi0.5Mn1.5O4 with lithium concentration. Reproduced with permission [67]. Copyright 2023, American Chemical Society.
2.3
Theoretical capacity and average open-circuit voltage calculation
Battery capacity is one of the key indicators of battery performance, representing the amount of charge a battery can release under specific conditions (discharge rate, temperature, cutoff voltage, etc.), typically measured in ampere-hours (Ah, where 1 Ah = 3600 C). Battery capacity can be classified into actual capacity, theoretical capacity, and rated capacity based on different conditions. Theoretical capacity refers to the amount of charge that would be released if all the active material participated in the battery reaction, representing the capacity in the most ideal state. The formula for calculating the theoretical capacity of different electrode materials is as follows:
Q=NF/3.6MW
(2)
where Q is the specific capacity (mAh/g), N is the number of electrons transferred per molecule, F is the Faraday constant (C/mol), and MW is the molecular weight (g/mol). From Eq. 1, it can be seen that increasing the number of active sites and reducing the molecular weight are effective ways to improve the theoretical capacity of organic electrode materials [62,63]. Whereas, due to various factors such as nanoparticle radius, morphology, and structural characteristics, the actual capacity often differs from the theoretical capacity. The density of electrode materials can also obscure many redox active sites. That is why exposing more active sites in the electrode material can help increase its actual capacity, bringing the battery’s actual capacity closer to its theoretical capacity (Fig. 3d) [43,64,65].
The insertion voltage of Li+, Na+, and K+ is an important parameter for ion batteries. Ideally, the voltage plateau of the cathode material should be sufficiently high, while that of the anode material should be sufficiently low, to achieve a higher operating voltage, thereby providing higher energy density for the ion battery.
To demonstrate, the equilibrium battery voltage of a Li-ion battery is determined by the difference in lithium chemical potential (μLi) between the cathode and the anode [66]:
V=−μLicathode−μLianodezF
(3)
where z is the charge transferred, and F is the Faraday constant. The lithium chemical potential represents the change in free energy of the electrode material as a function of lithium content. Integrating Eq. 3 over a finite reaction range gives the average voltage (OCV) as a function of the change in the free energy of the combined cathode reaction (ΔGr), according to the Nernst equation:
V¯=−ΔGrzF
(4)
Within this approximation, the equilibrium voltage is given for a lithium transition metal oxide insertion cathode with a composition of LiMO2 and a lithium metal anode involved in the battery reaction.
Lix1MO2→yieldsLix2MO2+(x1−x2)Li
(5)
At low temperatures, the contribution of entropy to ΔGr is small, so the reaction free energy can be approximated as the internal energy (ΔGr = ΔEr). Accordingly, it can be calculated as:
where x1 > x2, the internal energies of the lithiated and delithiated phases, E(Lix1MO2) and E(Lix2MO2), as well as the internal energy of metallic lithium, E(Li), can be obtained from first-principles calculations.
Thereupon, by calculating the total energy of each substance before and after the reaction, the average open-circuit voltage of the cathode material can be determined using Eq. 6. Theoretical calculations can accurately predict the OCV of inserted ions in the material, which closely matches the experimental voltage values (Fig. 3e) [67-69]. Consequently, the theoretical capacity and OCV can be calculated to preliminarily select suitable cathode materials. Even so, the calculation process assumes that ion insertion into the lattice remains unchanged, neglecting phase changes during the charge and discharge processes, which leads to discrepancies between the calculated and actual voltage changes [67]. In conclusion, the phase change mechanisms during the charge and discharge processes need further investigation.
In cathode material research, combining theoretical calculations with experimental characterizations is crucial. Theoretical calculations can offer insights into the electronic structure and charge density distribution, which can be validated against experimental results obtained through techniques like XPS, XANES, and Raman spectroscopy, thereby revealing the materials’ electronic properties in depth. Furthermore, calculated parameters, including Eads, BL, dissociation energy, and diffusion pathways can clarify the mechanisms underlying interface stability, ion transport, and cycling performance. Theoretical calculations of capacity and OCV frequently coincide with experimental data, providing theoretical support for enhancing battery performance and developing new cathode materials.
3.
The application of theoretical calculations in the study of electrolytes for alkali metal batteries
3.1
Electronic structure calculation
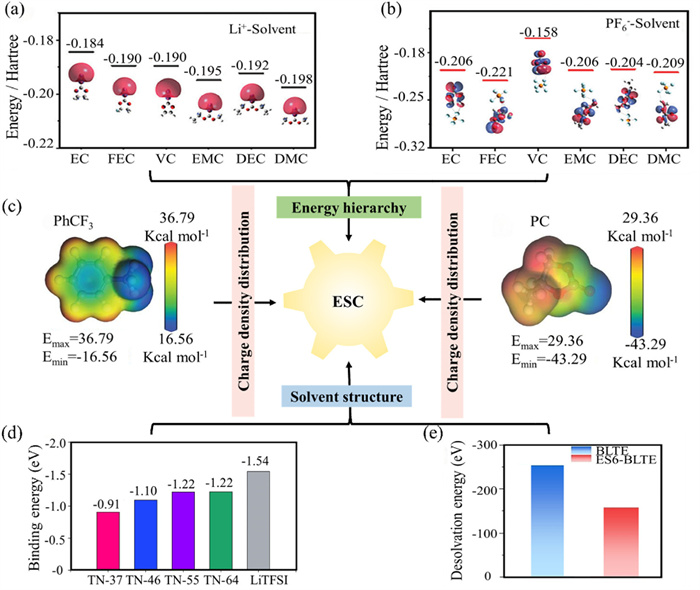
In the design of electrolytes, several solvent-related parameters must be considered, including energy level structures, charge density distribution, and solvation structures. These parameters are fundamental in influencing the processes of ion solvation and desolvation. The energy level structure of electrolytes is typically calculated using Gaussian software to determine the LUMO and HOMO levels [70]. These parameters are crucial for describing the electronic structure of molecules and significantly impact the chemical and electrochemical properties of electrolytes. The LUMO energy level indicates the ability of an electrolyte molecule to accept electrons. As shown in Fig. 4a, the higher the LUMO energy of Li+-solvent, the stronger its anti-reduction ability [70]. The HOMO energy level indicates the ability of an electrolyte molecule to lose electrons. As depicted in Fig. 4b, the lower the HOMO energy of PF6--solvent, the stronger its antioxidant ability [70,71].
Figure 4
Figure 4.
Electronic structural calculation. (a) LUMO of Li+-solvent. (b) HOMO of PF6−-solvent. Reproduced with permission [70]. Copyright 2024, Wiley-VCH Verlag. (c) The ESP results of PhCF3 and PC. Reproduced with permission [72]. Copyright 2023, Wiley-VCH Verlag. (d) Average Li+ binding energies of Li+ solvation structure for LiTFSI and TN electrolytes. Reproduced with permission [73]. Copyright 2024, Elsevier. (e) The desolvation energy of BLTE and ES6-BLTE electrolytes obtained from DFT calculations. Reproduced with permission [74]. Copyright 2024, Wiley-VCH Verlag.
The charge distribution and ESP of electrolytes are calculated using the Cambridge Sequential Total Energy Package (CASTEP) module in Materials Studio (MS) software. These calculations reveal details about the internal charge distribution, polarity, solvation behavior, and electrochemical reactivity of the molecules (Fig. 4c) [72]. The ESP reveals the charge distribution on the surface of electrolyte molecules, aiding in the prediction of interaction sites with other molecules. This information is essential for research of molecular recognition and ligand-receptor interactions. It also aids in identifying reactive sites within electrolyte molecules. Negative potential regions may point to electrophilic reaction sites, whereas positive potential regions may suggest nucleophilic reaction sites. The distribution of ESP affects the polarity and solubility of molecules and can be used to predict electrolyte solubility in various solvents.
In the study of ion batteries, the solvation structure is calculated using the MS (BIOVIA) software package. This is because the conductivity, stability, and reaction mechanisms of electrolyte ions are closely related to their solvation state within the electrolyte. Calculating the solvation structure aids in understanding and optimizing battery performance. As shown in Fig. 4d, the binding energy (Eb) reflects the interaction strength between ions and solvent molecules [73]. A higher Eb highlights that the ion is strongly solvated, forming a stable solvation shell. The binding energy affects the ion’s mobility within the electrolyte. A higher binding energy may result in a larger solvation shell, which can reduce the ion’s mobility. Accordingly, understanding the Eb can assist in selecting appropriate solvents, thereby improving the solubility and ionic conductivity of the electrolyte. Gaussian software is employed to calculate these solvation structures and evaluate the desolvation energy of the ions, which is pivotal for battery kinetics, particularly at low temperatures. As shown in Fig. 4e, theoretical calculations of the desolvation energy are used to assess the desolvation capability of alkali metal ions in the electrolyte during charge and discharge processes, as well as the kinetic characteristics of energy storage devices [74].
3.2
Ion migration calculation
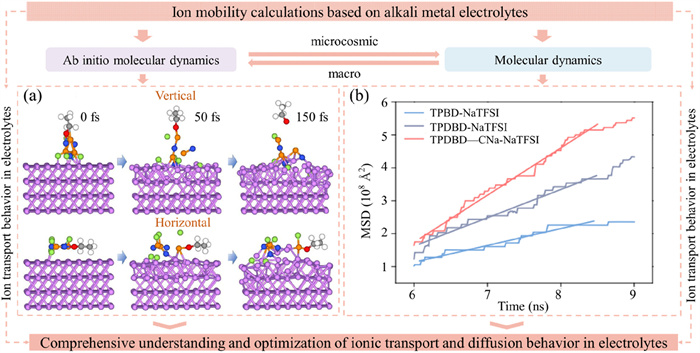
Studying ion migration and diffusion in electrolytes is essential since it directly influences the ionic conductivity of the electrolyte. These calculations primarily involve ab initio molecular dynamics (AIMD) simulations and molecular dynamics (MD) simulations.
AIMD simulations, based on density functional theory (DFT), utilize software like the Vienna ab initio simulation package (VASP) to compute electronic structures and interatomic interactions directly from quantum mechanical equations. This approach provides a more exact description of atomic motion and interactions within the system, especially in systems involving chemical reactions or complex charge transfers [75]. AIMD simulations are suitable for systems requiring high-precision electronic structure descriptions, such as solvent-separated ions, ion pairs, complex charge transfer processes, and chemical reaction kinetics in electrolytes. They are commonly used to study the microscopic structure and dynamic properties of electrolytes. As an illustration (Fig. 5a), AIMD simulation results illustrate the vertical and horizontal decomposition of phosphonitrile on the Li (110) surface, leading to the formation of lithium fluoride [75].
Figure 5
Figure 5.
Ion migration calculations. (a) The AIMD simulation results depicting vertical and horizontal phosphazene decomposition over the Li (110) surface, leading to LiF formation. Red spheres are the O atoms, lavender spheres denote Li atoms, green spheres are F atoms, blue spheres illustrate N atoms and orange spheres are P atoms. Reproduced with permission [75]. Copyright 2023, Elsevier. (b) MSD results of Na+ over time in three kinds of COFs. Reproduced with permission [76]. Copyright 2023, Springer Nature.
MD simulations primarily use the DMol3 module in MS software, which is suitable for large-scale and long-term simulations. These simulations are useful for studying macroscopic properties of electrolyte solutions (such as diffusion coefficients and conductivity), long-term dynamic behavior, and phase transition processes [76,77]. It is suitable for extensive screening and optimization of electrolyte materials. For instance, through molecular dynamics simulations, the mean squared displacement (MSD) of ions in the system can be calculated, which can then be used in conjunction with the Einstein relation formula [77]:
where D is the diffusion coefficient, N is the total number of particles in the system, Ri(t) is the position of species ⅲ at time t, and, Ri(0) is the reference position.
MSD is used to describe the mobility of ions in electrolytes, which is necessary for understanding electrolyte performance, such as conductivity and ion migration rates (Fig. 5b). MD provides theoretical guidance for designing efficient electrolyte materials. It follows that, AIMD can be used initially to study the solvation structure, charge distribution, and interaction forces of ions with solvent molecules. This information is then integrated into traditional MD force field models for large-scale and long-term simulations of electrolyte solutions to investigate their macroscopic properties, such as diffusion coefficients and conductivity.
To sum up, theoretical calculations are a key for studying electrolyte performance. The analysis of energy level structures uncovers the electrolyte’s redox capabilities, while calculations of ESP elucidate its activity and solubility across various solvents, thereby influencing the stability and applicability of the electrolyte. The solvation structure is intricately linked to ion transport performance, and molecular dynamics simulations profoundly elucidate the mechanisms of ionic conductivity. Utilizing these computational results, the electrolyte design can be effectively refined, thereby enhancing the ionic migration efficiency, cycle life, and overall battery performance.
4.
Applications of theoretical calculations to anode materials in alkali metal batteries
4.1
Electronic structure calculations
The performance of anode materials is critical for the overall battery performance, and research in this area frequently examines their electronic structure and charge density distribution. Theoretical calculations significantly support the understanding of anode materials’ working mechanisms and can elucidate their distinct electronic characteristics and charge distributions across different material classifications, such as insertion-type, alloy-type, and conversion-type anodes.
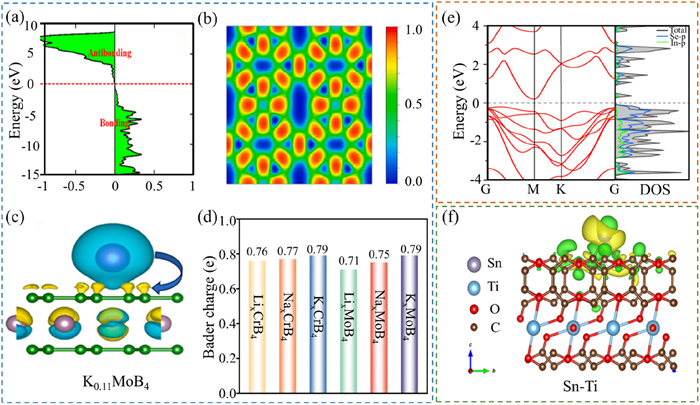
Intercalation-type anode materials, alternatively termed insertion-type anodes, are those that allow for the reversible intercalation or deintercalation of ions, such as lithium or sodium ions, within their lattice structure during the battery’s charging and discharging cycles. These anodes are typically composed of layered materials, such as MXene [78] and spinel titanates [79]. COHP calculations offer a comprehensive understanding of the chemical bonding properties within materials, especially in intercalation compounds, where they can elucidate the bonding strength and characteristics between intercalated ions and the host material (Fig. 6a) [80]. As depicted in Fig. 6b, the ELF in the study of intercalation anodes can identify and characterize the bonding regions between atoms and the distribution of lone pair electrons, thereby aiding in the comprehension of the material’s electronic structure and chemical bonding characteristics [81]. By calculating the differential charge density pre- and post-ion intercalation, the transfer and redistribution of charge within the material can be visually represented (Fig. 6c). BC analysis provides a methodology for quantifying the charge of atoms or ions, enabling an understanding of the charge transfer dynamics throughout the intercalation process (Fig. 6d) [82].
Figure 6
Figure 6.
Electronic structural calculation. (a) Calculated COHP of Li (K) atom adsorbed on C6. Reproduced with permission [80]. Copyright 2024, KeAi Communications Co., Ltd. (b) 2D ELF plot of b-BP super monomer. Reproduced with permission [81]. Copyright 2024, Elsevier. (c) Difference between charge density with isosurface value of 0.001 e/Å3 for K0.11MoB4. (d) BC diagrams for LixCrB4, NaxCrB4, KxCrB4, LxMoB4, NaxMoB4 and KxMoB4 (x = 0.11). Reproduced with permission [82]. Copyright 2024, Elsevier. (e) The BS and PDOS of In2Se3 monolayer. Reproduced with permission [58]. Copyright 2024, Springer US. (f) The corresponding charge density difference of the Sn atom loaded on the Ti-C-O structure. Reproduced with permission [86]. Copyright 2023, Tsinghua University Press.
Alloy anode materials are those that can form alloys with one or more elements during the charging and discharging processes of batteries. Typical examples are tin (Sn) [83] and silicon (Si) [84] anodes used in ion batteries. Electronic structure calculations disclose significant alterations in the energy level structure and DOS diagram of the material upon alloy formation, typically alongside a redistribution of electron density [58], as illustrated in Fig. 6e.
Conversion-type anode materials refer to a class of electrode materials that undergo reversible chemical reactions during the charging and discharging processes of batteries, allowing active ions to fully transform the constituents within the material, thereby storing or releasing energy. Unlike intercalation-type anode materials, conversion-type anodes experience more complex chemical reactions, which not only involve the intercalation or deintercalation of ions but also include complete phase transitions of the material’s crystal structure. Typical conversion-type anodes include metal oxides, metal sulfides, or metal selenides [85]. In theoretical calculations, the differential point charge density reveals that the energy level structure of these materials undergoes complex changes during the charging and discharging processes (Fig. 6f) [86]. Changes in the charge density distribution involve not only the insertion of ions but also the phase transition of the material, which significantly impacts the electrochemical performance of the material, such as capacity and stability.
4.2
Ion migration calculations
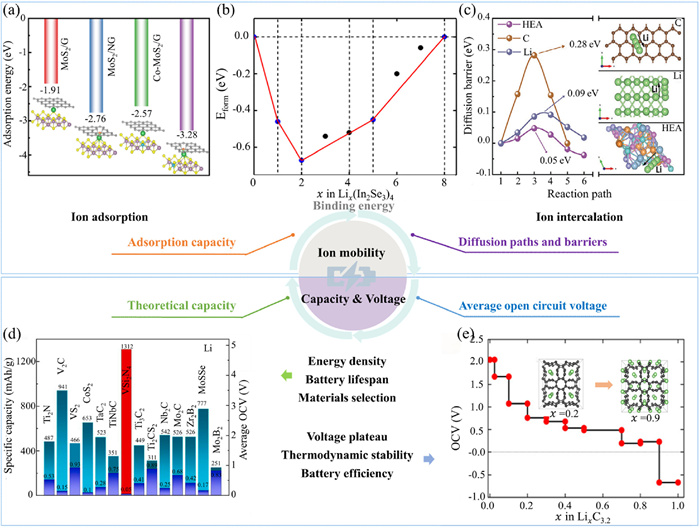
Ion migration calculations in anode materials, encompassing Eads, formation energy (Ef), migration pathways, and barriers, are primarily performed to understand and optimize battery performance, specifically focusing on key indicators such as energy density, power density, cycle life, and safety.
Eads in anode materials primarily involves two processes: the initial adsorption, which investigates the initial Eads of ions on the anode material surface, and the subsequent migration of ions from the electrolyte to the anode surface. This encompasses calculations of Eads [87] and Ef (Figs. 7a and b) [58]. The Ef and Eads of ions in anode materials refer to the energy changes associated with transferring ions from the electrolyte to the anode material. To exemplify, the Ef Li/Na/K ions on In2Se3 is defined by the following formula [58]:
Figure 7.
Ion migration calculations. (a) The Eads of Na+ at MoS2/G, MoS2/NG, Co-MoS2/G, Co-MoS2 (1:8)/NG interfaces. Reproduced with permission [87]. Copyright 2024, Elsevier. (b) Ef convex hull of Lix(In2Se3)4 systems. Reproduced with permission [58]. Copyright 2024, Springer US. (c) The Li+ diffusion barriers profiles of the HEA, Li and C. Reproduced with permission [88]. Copyright 2024, Wiley-VCH Verlag. (d) Comparison of the specific capacity and average OCV of VSi2N4 with other anodes containing transition metal elements and relatively heavy 2D ones. Reproduced with permission [89]. Copyright 2024, Elsevier. (e) Average open-circuit voltage of the lithiated 3D COT phase at different concentrations. Reproduced with permission [90]. Copyright 2024, Royal Society of Chemistry.
where E(MxIn2Se3), E(MnIn2Se3) and EIn2Se3 are the total energy of each substrate; M corresponds to the Li/Na/K ions; x represents the number of Li/Na/K ions in the intermediate phase; n is the number of ions on the fully loaded substrate.
Secondly, the insertion process further examines the energy changes associated with ions transitioning from the surface adsorption state into the interior of the material, including the ion migration pathways and barriers (Fig. 7c) [88]. Efficient diffusion pathways and low barriers are critical for the rapid charging and discharging capabilities of batteries. This enhances the ion migration rate and improves the rate capability of the battery. Comparison between cathode and anode materials reveals that anode materials generally exhibit lower diffusion barriers, facilitating faster ion migration.
4.3
Calculation of theoretical capacity and average open-circuit voltage
The theoretical capacity calculation methods for both anode and cathode materials are fundamentally similar, as they are both based on Faraday’s law. The theoretical capacities of anode and cathode materials can be calculated using Eq. 2 (Fig. 7d) [89].
High-capacity anode materials often need to manage greater expansion, contraction, and other structural changes, which can impact the battery’s cycle life. Hence, theoretical capacity is a critical factor in selecting anode materials. Researchers are actively investigating high-capacity materials to improve battery performance. The average open-circuit voltage of the anode material marks the operational voltage of the battery during charging and discharging. The calculation formula for this voltage is analogous to that used for cathode materials, as given in Eq. 6. The electrochemical reaction at the anode generally involves oxidation (loss of electrons), whereas the reaction at the cathode typically involves reduction (gain of electrons). This results in the free energy changes (ΔGr) of the anode and cathode having opposite signs in the voltage calculation, as shown in Eq. 4. To exemplify, the OCV of LixC3.2 when the ion concentration is x2 < x < x1 can be calculated based on the energy difference as follows [58,90]:
V¯(x2,x1)≈ELix1C3.2−ELix2C3.2+(x1−x2)μ(Li)(x1−x2)
(9)
Here ELix1/2C3.2 corresponds to the total energy of the two different intermediate phases; x1 and x2 represent the number of ions in the two intermediate configurations.
The difference in open circuit voltage (OCV) between the anode and cathode materials determines the voltage platform of the battery. For instance, in LIBs, calculating the OCV of the COT network at the maximum ion insertion level allows for the prediction of the battery’s theoretical voltage (Fig. 7e). This calculation estimates the voltage range the battery may attain during charging and discharging by analyzing potential changes across various intercalation states, thereby helping to avoid undesirable electrochemical reactions or material degradation. While a higher OCV can elevate the battery’s operating voltage and thus its energy density, the anode material’s OCV also influences the battery’s charging and discharging efficiency. A higher OCV typically indicates greater energy storage capacity, but it may also elevate the risk of irreversible reactions, thereby reducing Coulombic efficiency [91]. For this reason, selecting an appropriate anode material should consider its stable voltage platform to fulfill the requirements of a specific battery system. Table 1 provides an overview of the primary applications and specific aspects of theoretical calculations in the study of various anode materials. It encompasses the software employed, BS and DOS, BC, ELF, ESP, COHP, Eads, Ef, Eb, migration paths and barriers (MEP), OCV, AIMD simulations, phonon spectrum (PHS), stress-strain curves (SS curve), BL, and total energy (TE).
Table 1
Table 1.
The main applications and specific aspects of theoretical calculations in the study of various anode materials.
Theoretical calculations enable researchers to gain comprehensive insights into the electronic structure, ion migration pathways, thermodynamic stability, electrochemical performance, and interfacial behavior of anode materials. These computational results not only enhance the understanding of the fundamental properties of these materials but also guide the design and optimization of novel anode materials to improve battery performance. In contrast, calculations for cathode materials predominantly focus on aspects such as BS and DOS, ELF, ESP, COHP calculations, Eads, and MEP. These computational methods and analytical tools are pivotal in examining the electronic structure, adsorption characteristics, migration behavior, and chemical stability of cathode material [92-102].
As a result, anode materials are classified by their reaction mechanisms into intercalation-type, alloying-type, and conversion-type categories. Theoretical calculations uncover distinct electronic structures and charge density distributions across different materials. Parameters such as Eads, formation energy, migration pathways, and energy barriers within anode materials substantially influence the energy density, power density, cycle life, and safety of batteries. Moreover, the theoretical capacity and mean open-circuit voltage closely mirror the actual battery capacity and voltage observed in experiments, offering vital theoretical guidance for refining anode material design and boosting the overall battery performance.
5.
Conclusions and perspectives
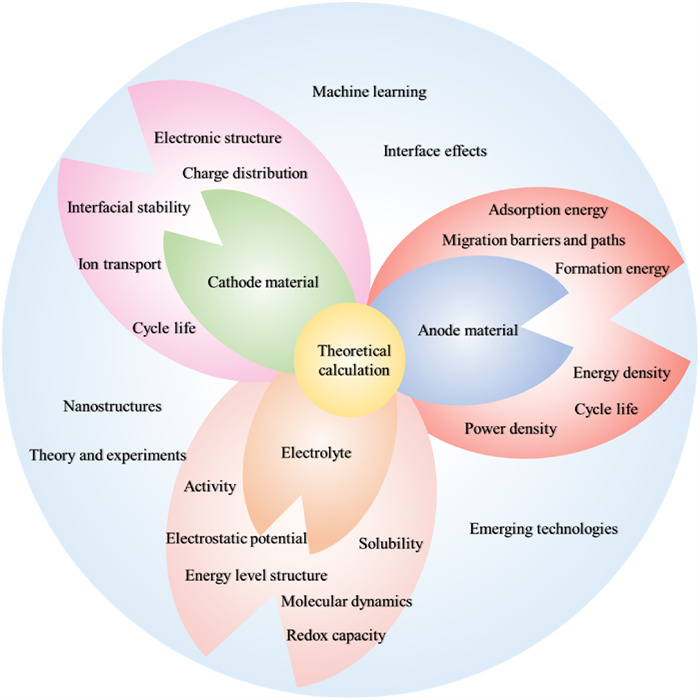
In this review, we examine the recent progress in applying theoretical calculations to the study of cathode materials, electrolytes, and anode materials for alkali metal-ion batteries. Theoretical calculations have been validated against experimental data, including XPS, XANES, and Raman spectroscopy, in the research of cathode materials, revealing the materials’ microscopic electronic structure and charge density distribution, thereby offering a substantial theoretical foundation for comprehending interfacial stability, ion transport, and cycle life in batteries. These computational findings illustrate the development of novel cathode materials. Regarding electrolytes, calculations of energy level structures and electrostatic potentials effectively assess redox capabilities, activity, and solubility, while molecular dynamics simulations further clarify the interplay between ionic conductivity and solvation structures, advancing the design and optimization of electrolytes. In the case of anode materials, theoretical calculations have enhanced the understanding of insertion-type, alloy, and conversion-type anodes, and by determining Eads, formation energy, and migration barriers and pathways, the materials’ energy density, power density, and cycle life are projected, thus contributing to the development of efficient anode materials. The role of theoretical calculations has progressively transitioned from a supplementary to a pivotal role. It is anticipated that the integration of theoretical calculations with experimental tests will significantly accelerate the research progress in battery materials. This integration not only facilitates the prediction of material performance prior to experimentation, reducing the experimental development cycle, but also offers nuanced guidance for material design, thereby enhancing battery performance across diverse operating conditions and fostering advancements in energy storage technology. The overall theme of this review is shown in Fig. 8. Admittedly, there are still some challenges in the theoretical calculations of electrode materials in alkali metal batteries that require further research:
Figure 8
Figure 8.
Schematic highlighting the theme of the review.
(1) Different calculation methods need to be considered for different types of cathode materials, for example, when PBAs are used as alkali metal cathode materials, the solubility of the cathode materials needs to be considered in the theoretical calculation, so as to reduce the dissolution of electrolyte and improve ion kinetics.
(2) To enhance the performance of alkali metal-ion batteries, effectively applying theoretical computational methods to understand the electrode-electrolyte interface interactions is crucial. Developing new models for more accurate simulations of these processes will significantly improve battery performance and stability.
(3) While modeling alloy materials used as anode materials is relatively straightforward, further research is needed to understand how theoretical calculations can be utilized to enhance mechanisms related to strategies like nanostructuring, phase coupling, and microstructural design for improving the energy storage properties of electrode materials.
(4) Integrating theoretical calculations with experimental methods to overcome the limitations of each approach is key for providing a more comprehensive and in-depth understanding of materials, as well as accelerating the development and optimization of new materials.
(5) In future research, more cutting-edge technologies such as machine learning should be integrated to deepen the theoretical calculation of the impact of battery anode, cathode and electrolyte interface effects on energy storage performance.
Declaration of competing interest
The authors declare that they have no known competing financial interests or personal relationships that could have appeared to influence the work reported in this paper.
This work was supported by National Natural Science Foundation of China (No. 52250710161) and Shaanxi Province "two chains" integration key project (No. 2024ZG-JBGS-008).
[1]
H. Feng, Y. Han, Y. Wang, et al., J. Colloid Interface Sci. 667 (2024) 237–248. doi: 10.1016/j.jcis.2024.04.085
M. Ma, K. Yao, Y. Wang, et al., Adv. Funct. Mater. 34 (2024) 2315662. doi: 10.1002/adfm.202315662
Figure 1
Calculation of energy level structure. (a) Energy band diagrams of MoS2. Reproduced with permission [45]. Copyright 2023, Elsevier. (b) The DOS of Na0.67Mn0.53Ni0.30Co0.17O2. Reproduced with permission [46]. Copyright 2023, Wiley-VCH Verlag. (c) The COHP analyses on O-Li. Reproduced with permission [49]. Copyright 2024, Elsevier. (d) Electronic localization function map of NM system and LMNM system [50]. Reproduced with permission [50]. Copyright 2023, Wiley-VCH Verlag.
Figure 2
Calculation and experiment of electronic structure. (a) Charge density difference of NLMO. Reproduced with permission [51]. Copyright 2024, Royal Society of Chemistry. (b) BC of O in various TM-O6 configuration. Reproduced with permission [52]. Copyright 2024, Wiley-VCH Verlag. (c) Molecular electrostatic potential (MESP) map of BFPPQ-COF repetitive units showing possible active sites [53]. Reproduced with permission [53]. Copyright 2023, Wiley-VCH Verlag. (d) XPS spectra and the high-resolution of Ni 2p. Reproduced with permission [49]. Copyright 2024, Elsevier. (e) corresponding synchrotron Fe K-edge XANES during charging. Reproduced with permission [56]. Copyright 2023, Royal Society of Chemistry. (f) Raman spectroscopy of NMC811 and ZAO@NMC811 [57]. Copyright 2023, Elsevier.
Figure 3
Ion migration calculations, theoretical capacity and average open circuit voltage calculations. (a) Ion migration calculations. Differential charge densities of FEC-P/Fe-N-C and FEC-P/N—C and Eb C-F bonds in FEC. Reproduced with permission [59]. Copyright 2024, Wiley-VCH Verlag. (b) Interfacial adsorption and decomposed behaviors of electrolyte components (FEC and ClO4-) on different cathode crystal planes with corresponding adsorption distances and bond rupture energies [60]. Copyright 2023, Springer Nature. (c) The migration energy for Ni to diffuse from the TM layer to Li layer, under different situations. Reproduced with permission [55]. Copyright 2023, Wiley-VCH Verlag. (d) Theoretical capacity and actual capacity of cathode materials in alkali metal batteries [43,64,65]. (e) Variation of average intercalation voltage of spinel-type LiMn2O4 and spinel-type LiNi0.5Mn1.5O4 with lithium concentration. Reproduced with permission [67]. Copyright 2023, American Chemical Society.
Figure 4
Electronic structural calculation. (a) LUMO of Li+-solvent. (b) HOMO of PF6−-solvent. Reproduced with permission [70]. Copyright 2024, Wiley-VCH Verlag. (c) The ESP results of PhCF3 and PC. Reproduced with permission [72]. Copyright 2023, Wiley-VCH Verlag. (d) Average Li+ binding energies of Li+ solvation structure for LiTFSI and TN electrolytes. Reproduced with permission [73]. Copyright 2024, Elsevier. (e) The desolvation energy of BLTE and ES6-BLTE electrolytes obtained from DFT calculations. Reproduced with permission [74]. Copyright 2024, Wiley-VCH Verlag.
Figure 5
Ion migration calculations. (a) The AIMD simulation results depicting vertical and horizontal phosphazene decomposition over the Li (110) surface, leading to LiF formation. Red spheres are the O atoms, lavender spheres denote Li atoms, green spheres are F atoms, blue spheres illustrate N atoms and orange spheres are P atoms. Reproduced with permission [75]. Copyright 2023, Elsevier. (b) MSD results of Na+ over time in three kinds of COFs. Reproduced with permission [76]. Copyright 2023, Springer Nature.
Figure 6
Electronic structural calculation. (a) Calculated COHP of Li (K) atom adsorbed on C6. Reproduced with permission [80]. Copyright 2024, KeAi Communications Co., Ltd. (b) 2D ELF plot of b-BP super monomer. Reproduced with permission [81]. Copyright 2024, Elsevier. (c) Difference between charge density with isosurface value of 0.001 e/Å3 for K0.11MoB4. (d) BC diagrams for LixCrB4, NaxCrB4, KxCrB4, LxMoB4, NaxMoB4 and KxMoB4 (x = 0.11). Reproduced with permission [82]. Copyright 2024, Elsevier. (e) The BS and PDOS of In2Se3 monolayer. Reproduced with permission [58]. Copyright 2024, Springer US. (f) The corresponding charge density difference of the Sn atom loaded on the Ti-C-O structure. Reproduced with permission [86]. Copyright 2023, Tsinghua University Press.
Figure 7
Ion migration calculations. (a) The Eads of Na+ at MoS2/G, MoS2/NG, Co-MoS2/G, Co-MoS2 (1:8)/NG interfaces. Reproduced with permission [87]. Copyright 2024, Elsevier. (b) Ef convex hull of Lix(In2Se3)4 systems. Reproduced with permission [58]. Copyright 2024, Springer US. (c) The Li+ diffusion barriers profiles of the HEA, Li and C. Reproduced with permission [88]. Copyright 2024, Wiley-VCH Verlag. (d) Comparison of the specific capacity and average OCV of VSi2N4 with other anodes containing transition metal elements and relatively heavy 2D ones. Reproduced with permission [89]. Copyright 2024, Elsevier. (e) Average open-circuit voltage of the lithiated 3D COT phase at different concentrations. Reproduced with permission [90]. Copyright 2024, Royal Society of Chemistry.

 DownLoad:

 下载:
下载:


 下载:
下载:
