Citation:
Wenting Li, Nina Wu, Chengze Li, Jin Guo, Guangxun Zhang, Huan Pang. Facet engineering of NH2-MIL-125(Ti) for enhanced synergistic adsorption and photocatalysis reduction of U(Ⅵ) under visible light[J]. Chinese Chemical Letters,
2026, 37(4): 110733.
doi:
10.1016/j.cclet.2024.110733
Facet engineering of NH2-MIL-125(Ti) for enhanced synergistic adsorption and photocatalysis reduction of U(Ⅵ) under visible light
English
Facet engineering of NH2-MIL-125(Ti) for enhanced synergistic adsorption and photocatalysis reduction of U(Ⅵ) under visible light
Received Date:
04 November 2024 Accepted Date:
05 December 2024 Revised Date:
28 November 2024 Available Online:
15 April 2026
Abstract:
Modulating the exposed facets of metal-organic frameworks (MOFs) is an effective strategy to enhance the synergistic effects between adsorption and photocatalytic reduction of U(Ⅵ). Herein, we successfully synthesized four morphologically distinct types of NH2-MIL-125(Ti), offering insights into the impact of facet engineering on the combined adsorption and photoreduction of U(Ⅵ). An elevated exposure ratio of the {001} facet endows NH2-MIL-125(Ti) with a larger surface area, enhanced light absorption, and efficient separation of photogenerated charge carriers. Among the four photocatalysts (W, D, S and T), T with a high proportion of {001} facets, demonstrated outstanding adsorption-photocatalytic synergy, achieving over 97% of U(Ⅵ) within 20 min of visible light irradiation across a broad concentrations and pH range, without requiring a hole-trapping agent. The uranium extraction mechanism involves U(Ⅵ) coordination and chelation with active sites during adsorption, followed by reduction to U(Ⅳ) via photogenerated electrons during photocatalysis. This study highlights the use of facet engineering to enhance adsorption and photocatalytic efficiency in MOF-based photocatalysts.
With rapid population growth and industrial expansion, the issues of energy shortages and severe pollution from fossil fuels have become increasingly critical [1]. Currently, the most effective solution is to seek alternative energy sources, particularly nuclear power [2]. Although nuclear energy is economical, convenient, and clean with a high energy density, it inevitably generates uranium-containing pollutants with chemical, biological, and radiological toxicity, posing significant threats to human health and the environment [3]. As a result, researchers have concentrated their efforts on the development of straightforward, effective, and eco-friendly methods to eliminate uranium contaminants from water. Diverse techniques have been established for the removal and recycling of uranium-containing waste, including chemical reduction [4,5], evaporative concentration [6,7], biological treatment [8,9], adsorption [10,11], and photocatalytic reduction [12,13]. Photocatalytic reduction is especially distinguished by its outstanding effectiveness, the absence of secondary pollutants, simplicity, reusability, and minimal energy consumption [14]. This method converts easily dissolved U(Ⅵ) in wastewater to little-dissolved U(Ⅳ) upon exposure to light irradiation, thus purifying water and recovering uranium resources [15,16]. This process includes light absorption by the photocatalyst, the photoinduced electron-hole pairs separation, the photoinduced electrons migration, and the adsorption and subsequent reduction of U(Ⅵ). Crucially, photocatalysts are essential for increasing this process's efficiency, making it vital to identify and develop photocatalysts capable of effectively removing hexavalent uranium from aqueous environments.
Metal-organic framework (MOF)-based photocatalysts have attracted considerable interest in recent years [17-19]. MOFs are innovative hybrid materials that consist of organic ligands coordinated with metal ions or clusters, forming a three-dimensional porous network [20]. Their morphology and structure are distinct from traditional inorganic semiconductor materials. Nano-MOFs exhibit significant potential for advancement in photocatalysis and water treatment due to their varied architectures, extensive specific surface area, elevated porosity, plentiful active sites, and straightforward processing [21-23]. Specifically, Ti-based MOFs exhibits not only cheapness, non-hazardous, as well as robust physical and chemical properties, but also excellent visible light response, photocatalytic activity, and an appropriate band gap [24,25]. The conduction band position is more negative than the potential required for U(Ⅵ) reduction (UO22+/U4+ at 0.267 V, UO22+/UO2 at 0.411 V), indicating that U(Ⅵ) reduction by Ti-based MOF is through thermodynamics viable. Nonetheless, the photocatalytic reduction process is hindered by the fact that most catalytic active sites (metal nodes in the metal oxygen cluster) are primarily located inside its framework [26,27]. To address this, recent studies have explored the impact of MOFs on photocatalytic reactions, showing that surface engineering can maximize the exposure of active sites and thus achieve enhanced photocatalytic activity [28-30].
Facet engineering, achieved by adjusting the morphology of MOFs, also plays a crucial role. Facets with varying crystallographic characteristics affect the band gap and electron transmission mechanisms [31]. For example, Sun et al. synthesized NH2-MIL-125(Ti) possessing varying facets, finding that the {110}/{111}-heterojunction enhanced CO2 reduction to CO and CH4 by 10 and 18 times compared to the single {001} facet [32]. Liu et al. later discovered that exposing {001} facets with abundant six-coordinated Ti atoms also promoted photocatalytic hydrogen evolution [33]. These findings highlight the importance of facet regulation for photocatalytic performance, which effectively controls light absorption, active site distribution, surface electronic structure, and electron transport, thus enhancing photocatalytic reduction reactions [34-36]. However, research on tailoring the morphologies/facets of NH2-MIL-125(Ti) to improve the synergistic effect between their U(Ⅵ) adsorption and its photocatalytic reduction remains scarce.
This study presents the synthesis of four distinct NH2-MIL-125(Ti) morphologies using a solvothermal reaction, achieved by altering reactant concentrations without employing morphology control agents. These morphologies correspond to circular (W), tetrahedral (T), dodecahedral (D), and square (S) shapes, designed for surface engineering. The synergistic performance of adsorption and photocatalysis for U(Ⅵ) was also investigated. According to experimental findings, T maximizes the synergistic effect of U(Ⅵ) adsorption and photocatalytic reduction, which can be attributed to the high exposure ratio of the {001} facet. Notably, the {001} facet offers a substantial specific surface area, facilitates efficient pair of electrons-holes separation, as well exhibits favorable U(Ⅵ) adsorption energy, collectively enhancing U(Ⅵ) photocatalytic reduction.
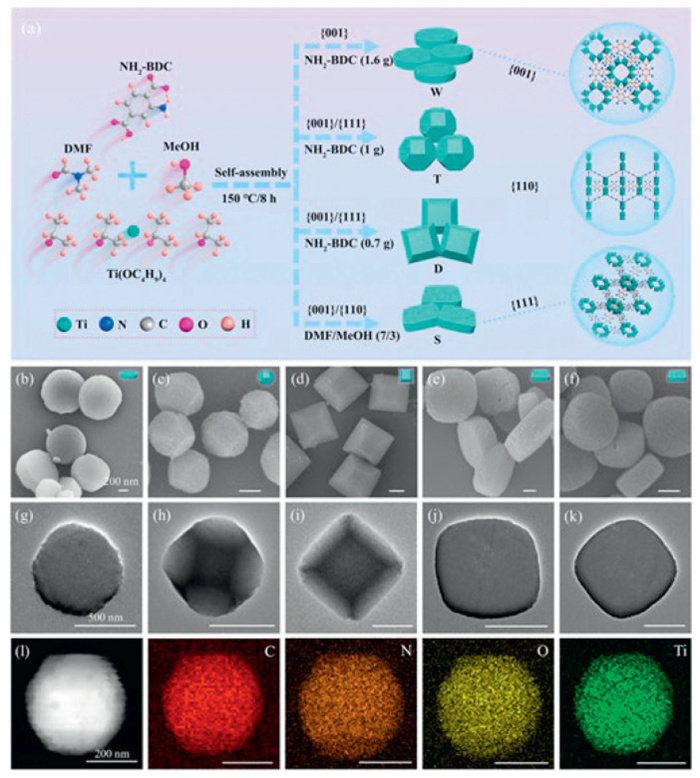
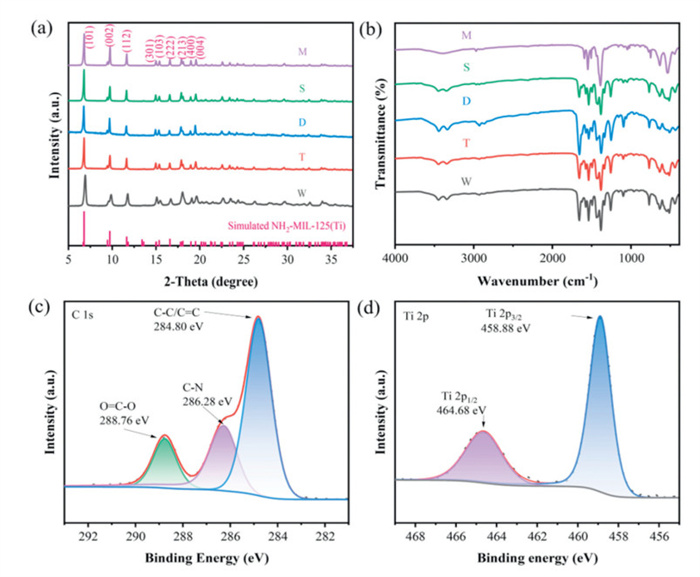
NH2-MIL-125(Ti) with four distinct morphologies and crystallographic facets were hydrothermally synthesized at 150 ℃ for 8 h using tetraisopropyl orthotitanate (Ti(OCH(CH3)2)4) as the metal salt, 2-aminoterephthalic acid (NH2-BDC) as the organic ligand, and a solvent mixture of DMF and methanol, with varying reactant concentrations and DMF/MeOH ratios (Fig. 1a). It was observed that variations in reaction time exhibited minimal impact on morphology and surface features (Fig. S1 in Supporting information), and the crystal structure remained unchanged (Fig. S2 in Supporting information). Fig. S3 (Supporting information) presents the definition and identification of the {001}, {110}, and {111} facets. The mechanism of solvent regulation of crystal face ratio primarily involves (1) the deprotonation of the linker's carboxylic acid groups, forming anions that coordinate with metal ions, resulting in the formation of a thermodynamically stable MOF crystal, and (2) hydrogen bonding between water and the linker, which typically inhibits MOF formation. Moreover, the solvent can function as a secondary structural regulator by competing with multidentate linkers for metal coordination, thereby controlling the rate of framework extension and crystal growth. These interactions result in varying surface energies across different MOF crystal facets, which in turn affect the growth rates of these facets, ultimately yielding diverse crystal morphologies. The association across the morphology and crystallographic planes adheres to Steno's law, which was used to define the crystallo-graphic facet (Fig. S4 and Table S2 in Supporting information) [37]. Utilizing scanning electron microscopy (SEM) and transmission electron microscopy (TEM), the morphologies and crystal plane characteristics of the synthesized Ti-MOFs were clearly observed. As illustrated in Figs. 1b-e, NH2-MIL-125(Ti) with four distinct morphologies exhibited: circular shapes with exposed {001} surfaces, tetrakaidecahedron with {001}/{111} mixed surfaces, decahedron with {001}/{111} mixed surfaces, and square with {001}/{110} mixed surfaces, designated as W, T, D and S, respectively. TEM images (Figs. 1g-j) confirmed results consistent with those from SEM. Additionally, MIL-125(Ti), designated M, was used as a control sample, with corresponding SEM and TEM images shown in Figs. 1f and k. The average diameters of W, T, D, S and M were measured as 236.3, 465.1, 860.0, 810.0 and 640.0 nm, respectively (Fig. S6 in Supporting information). According to Figs. S4 and S5 (Supporting information), the average percentages of exposed {001}, {111} and {110} facets were provided in Table S3 (Supporting information) [38]. Fig. 1l presents the morphology of sample T alongside the corresponding energy-dispersive spectrum elemental mapping (SEM-EDS), revealing that T is composed of evenly scattered C, N, O and Ti elements. The crystalline phases of the synthesized Ti-MOFs were analyzed via the method of powder X-ray diffraction (PXRD) (Fig. 2a). It was evident that all samples exhibited similar X-ray diffraction (XRD) peaks, which aligned with the simulated NH2-MIL-125(Ti), indicating successful synthesis. Additionally, substitution of the -H group with an NH2 group in the organic linker did not significantly alter the crystal structure of MIL-125(Ti) [39,40].
Figure 1
Figure 1.
(a) Schematic diagram for the preparation of NH2-MIL-125 samples. SEM images of as-synthesized (b) W, (c) T, (d) D, (e) S and (f) M. TEM images of (g) W, (h) T, (i) D, (j) S and (k) M. (l) HAADF-STEM image and EDS mapping of T.
To further elucidate the functional groups and molecular structures of the synthesized samples, Fourier transform infrared spectroscopy (FT-IR) measurements were conducted (Fig. 2b). The results indicate that the characteristic peaks of the four different morphologies of NH2-MIL-125(Ti) remain consistent across all sample, suggesting that they possess the same chemical bonds and functional groups. In comparison to sample M, two additional vibration absorption peaks at 3453 and 3342 cm-1 were observed. These peaks correspond to the symmetric and asymmetric stretching vibrations of the -NH2 group in the NH2-BDC organic ligand [41,42]. The tensile vibrations of the aromatic amine C-N occur at 1257 and 1339 cm-1 [43,44]. The peak at 1657 cm-1 is attributed to the N-H bending vibration of the aromatic amines [45]. The peaks at 1575 and 1382 cm-1 are assigned to the symmetric vibration of the carboxylate linker, while the peaks at 1539 and 1438 cm-1 are assigned to its asymmetric vibration [46]. The stretching vibration of O-Ti-O is linked to the bands (766, 631 and 440 cm-1) seen in 400–800 cm-1 region [47]. The chemical compositions and elemental chemical states of the samples were analyzed using high resolution X-ray photoelectron spectroscopy (HR-XPS). XPS survey spectra (Fig. S7 in Supporting information) reveal that the T sample is primarily composed of four elements: C, N, O and Ti, confirming that NH2-MIL-125(Ti) was successfully produced, which is in line with the findings in Fig. 1l. The C 1s XPS spectrum (Fig. 2c) of sample T exhibits peaks at 284.80, 286.28 and 288.76 eV, which correspond to the C-C/C = C, C-N and O = C bonds of NH2-BDC, respectively [48]. The Ti 2p high-resolution spectrum of sample T exhibits two peaks attributed to Ti 2p1/2 and Ti 2p3/2, with bond energies of 464.68 and 458.88 eV, respectively [49], confirming that titanium in the titanium-oxygen cluster is in the Ⅳ oxidation state (Fig. 2d).
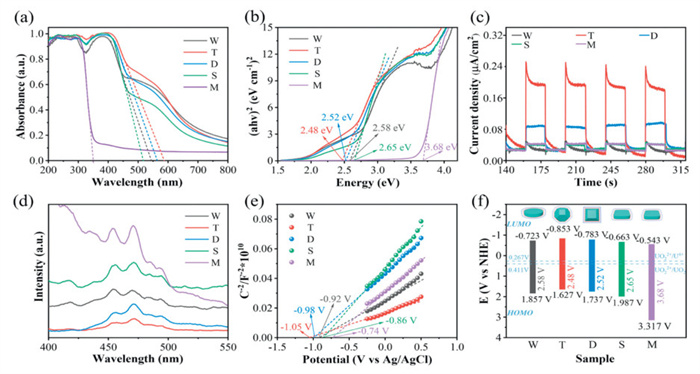
To explore the photoelectrochemical properties of the synthesized photocatalysts, their ultraviolet-visible diffuse reflection absorption spectra (UV–vis DRS) were obtained. As shown in Fig. 3a, the absorption band edge of sample M falls below 400 nm, suggesting it can only be excited by ultraviolet light. In contrast, NH2-MIL-125(Ti)'s absorption boundary is significantly redshifted relative to that of M [50], and includes two absorption peaks corresponding to the titanium-oxygen group and ligand group adsorptions. This suggests that amino groups (-NH2) can effectively broaden the visible light absorption range, shifting the absorption edge to the visible region and greatly improving light utilization. Additionally, the light absorption ability of T exceeds that of W, D and S, indicating that light absorption ability can be enhanced by adjusting the ratio of {001} to {111} facets. Based on the Tauc diagram obtained by DRS, the HOMO-LUMO gap of T, W, D, S and M were calculated as 2.19, 2.30, 2.25, 2.45 and 3.57 eV, respectively (Fig. 3b). Among them, the HOMO-LUMO gap of T is minimized, indicating that the electron transition energy barrier is the lowest, greatly improving photocatalytic performance. Previous studies have shown that Ti 3d and O 2p orbitals constitute the LUMO level of the catalysts, whereas C 2p orbitals in NH2-BDC constitute the HOMO level [51]. This indicates that the morphology/crystal plane regulation of NH2-MIL-125(Ti) can be used to tune the electrical structure of its surface. Fig. S8 (Supporting information) and Fig. 3e show the Mott-Schottky curves of the synthesized catalysts, with positive slopes, demonstrating that these catalysts are n-type semiconductors dominated by electronic conduction [52]. Additionally, the Mott-Schottky diagram can be employed to determine the photocatalyst's flat band potential (EFB), which can subsequently be utilized to calculate the HOMO-LUMO gap edge (Fig. 3f). The LUMO energy level potentials of T, W, D, S and M were calculated as −0.923, −0.723, −0.843, −0.643 and −0.663 V vs. NHE, respectively [53]. These values are more negative than the reduction for the conversion of UO22+/U4+ (0.267 V vs. NHE) and UO22+/UO2 (0.411 V vs. NHE) photocatalytically [54,55], based on thermodynamic principles, indicating that the photogenerated electrons in the synthesized catalysts have a strong photocatalytic reduction potential for the reduction of U(Ⅵ) to U(Ⅳ). The oxidation potential of H2O/·OH is +2.8 V (vs. SHE, in acidic solution). Meanwhile, the HOMO energy level potentials were measured as 1.267, 1.577, 1.407, 1.807 and 2.907 V vs. NHE, respectively. In summary, T has a broader visible light response range, a narrower band gap, and a more negative HOMO energy level potential, demonstrating its enhanced photocatalytic reduction capability for U(Ⅵ).
Figure 3
Figure 3.
(a) UV–vis DRS spectra. (b) Band gap of M, W, T, D and S. (c) Transient photocurrent responses. (d) Steady PL spectra under 320 nm excitation. (e) Mott-Schottky plots in a 0.2 mol/L Na2SO4 aqueous solution (pH 6.8). (f) HOMO-LUMO gap of the as-synthesized photocatalysts.
In addition, steady-state photoluminescence (PL) spectroscopy was employed to investigate the ability of photogenerated electron-hole pairs for separation and transfer within the synthesized photocatalysts. A higher PL peak indicates lower electron-hole pairs separation efficiency and higher recombination efficiency [56]. As shown in Fig. S9 (Supporting information), the PL peak intensities of T, D, W, S and M increased in sequence, indicating that the separation efficiency of photogenerated electron-hole pairs decreased accordingly, while recombination efficiency increased correspondingly. This demonstrates that high efficiency electron transfer occurs in sample T. We measured the transient photocurrent response throughout four on-off cycles in order to assess the separation as well as migration efficiency of photogenerated electrons in more detail (Fig. 3c). The transient photocurrent density of T significantly exceeds that of other photocatalysts, demonstrating that T possesses the largest yield of photogenerated electrons and superior electron transfer efficiency, hence corroborating the results from PL spectroscopy [57]. The Nyquist plot (Fig. 3d) shows that the radius of the Nyquist curve for T is the smallest, indicating that T exhibits the lowest interfacial charge transfer resistance, resulting in superior electrical conductivity and faster electron transfer rates at the interface [58]. Thus, the utilization efficiency of photogenerated electrons is greatly improved, and the photocatalytic reaction process is accelerated. These test results all show consistent trends, indicating that NH2-MIL-125(Ti)'s photocatalytic reduction efficiency varies depending on the exposed facets, particularly for T with exposed {001}/{111} facets, which demonstrates excellent photocatalytic activity for U(Ⅵ) reduction.
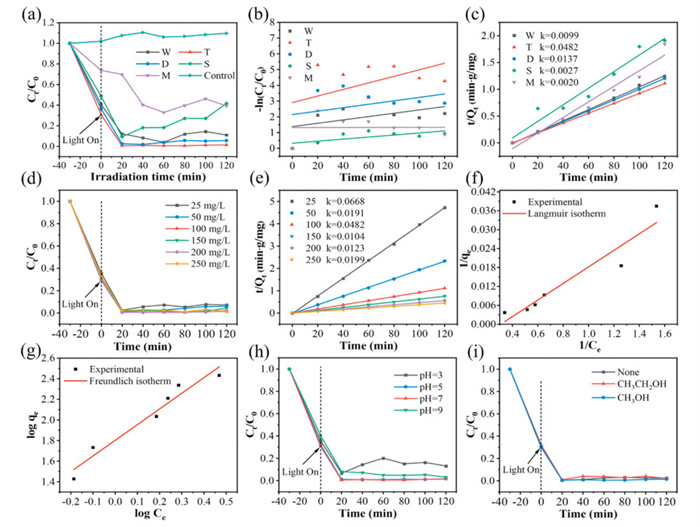
The extraction of uranyl ions by a photocatalyst involves two stages: (1) U(Ⅵ) is adsorbed onto the surface of the photocatalyst via coordination chelation under dark conditions, allowing the photocatalyst to reach adsorption saturation with U(Ⅵ); (2) Upon light irradiation, the photocatalyst reduces U(Ⅵ) adsorbed on the surface to insoluble U(Ⅳ), causing it to precipitate. To enhance the uranium extraction efficiency during adsorption and photocatalytic reduction, the synthesized photocatalysts were tested. As shown in Fig. 4a, the concentration of U(Ⅵ) in solution remains unchanged under visible light irradiation without any photocatalyst, which indicates that U(Ⅵ) remains stable without photolysis [55]. After the synthesized photocatalysts reached adsorption-desorption equilibrium in the dark, the photocatalytic reduction U(Ⅵ) properties of the various morphologies of NH2-MIL-125(Ti) (T, W, D, S) and M were investigated under light conditions. It was observed that NH2-MIL-125(Ti) rapidly extracts U(Ⅵ) from solution within the first 20 min of photocatalysis, after which the concentration of uranyl ions stabilizes after 100 min. Specifically, the U(Ⅵ) removal rates by T, D, W and S were 99%, 98%, 96% and 90%, respectively, while the removal rate for M was only 67%. In addition, the kinetic fitting of the photocatalyst reaction rate was performed (Eqs. S2 and S3 in Supporting information), as illustrated in Figs. 4b and c and Table S4 (Supporting information). The proximity of R22 to 1 compared to R12 indicates conformity with pseudo-second-order kinetics. The reaction rate constants (k) of the synthesized photocatalysts were as follows: T (0.0482 min-1) > D (0.0137 min-1) > W (0.0099 min-1) > S (0.0027 min-1) > M (0.0020 min-1). Specifically, a larger reaction rate constant indicates a faster reaction. To investigate how facets affect the photocatalytic reduction of U(Ⅵ), nitrogen adsorption-desorption isotherms and pore size distribution curves were obtained, and the specific surface area of the synthesized samples were calculated (Fig. S10 and Table S1 in Supporting information). A larger specific surface area enhances the photocatalyst's ability to effectively contact and retain hexavalent uranium ions in solution [59]. Among them, W and T exhibited type Ⅰ isotherms, indicating the presence of a microporous structure. T demonstrates strong N2 adsorption capacity at low relative pressure (P/P0 < 0.001), whereas D exhibited type Ⅳ isotherms with an H3 hysteresis loop, indicating mesoporous characteristics. T possesses the largest specific surface area (717.263 m2/g). Furthermore, as the {001}/{111} exposure ratio increases, the catalyst's surface area also exhibits a positive trend. These results indicate that the amino group introduced by the organic ligand (NH2-BDC) can enhance the photosensitive effect and improves light collection efficiency in the visible region, thereby significantly improving the photocatalytic reduction activity of U(Ⅵ) by NH2-MIL-125(Ti). Consequently, T was selected as the photocatalyst for further investigation into the effect of initial U(Ⅵ) concentration, pH value, and different hole-trapping agents on U(Ⅵ) extraction.
Figure 4
Figure 4.
(a) Photocatalytic removal of U(Ⅵ) by M and NH2-MIL-125(Ti) with different morphologies. Photocatalytic reaction conditions: [U(Ⅵ)] initial = 100 mg/L, V = 20 mL, m = 20 mg, pH 7. (b) Pseudo-first-order kinetic model and (c) pseudo-second-order kinetic model with the above samples. (d) Effect of U(Ⅵ) concentration, V = 20 mL, m = 20 mg, pH 7. (e) Pseudo-second-order model of U(Ⅵ) reduction at different initial U(Ⅵ) concentration (25–250 mg/L), V = 20 mL, m = 20 mg, pH 7. (f) Langmuir model. (g) Freundlich model. (h) Photocatalytic removal of U(Ⅵ) by T under different pH values. Photocatalytic reaction conditions: [U(Ⅵ)] initial = 100 mg/L, V = 20 mL, m = 20 mg. (i) Photocatalytic removal of U(Ⅵ) by T under kinds of hole trapping agent. Photocatalytic reaction conditions: [U(Ⅵ)] initial = 100 mg/L, V = 20 mL, m = 20 mg, pH 7.
The effect of different initial concentration of uranium solution on T's photocatalytic reduction of U(Ⅵ) was studied [60]. As shown in Fig. 4d, when the initial concentrations of uranium solution were 25, 50, 100, 150, 200 and 250 mg/L, the extraction rate of uranium exceeded 97% after T was exposed to visible light for 20 min. After 100 min, the amounts of U(Ⅵ) extracted were 23.22, 46.98, 98.60, 143.52, 195.37 and 246.88 mg/g, respectively. This indicates that T possesses excellent U(Ⅵ) extraction capabilities across a wide range of U(Ⅵ) concentration. As the initial concentration of the solution gradually increases, the extracted U(Ⅵ) amount shows an upward trend. This can be attributed to the increase probability of contact between U(Ⅵ) and the surface of T, leading to more U(Ⅵ) reduction within the same illumination time, thereby enhancing T's photocatalytic performance. In addition, the kinetic fitting of the experimental data was conducted (Fig. 4e and Table S5 in Supporting information). Relative to pseudo-first-order kinetics, pseudo-second-order kinetics provided a superior fit, as evidenced by significantly higher correlation coefficients (R22 > 0.99). When an initial U(Ⅵ) concentration is 25 mg/L, the reaction rate constant was the highest, indicating a faster photocatalytic reduction reaction, likely due to abundant active sites and greater light exposure on the surface of photocatalyst T. The equilibrium data of U(Ⅵ) adsorption on T were evaluated using Langmuir, Freundlich, and Temkin isothermal models. The thermodynamic parameters of these models were calculated using equations (Eqs. S6-S8 in Supporting information), with results depicted in Figs. 4f and g, Fig. S12 and Table S6 (Supporting information). The fitted curves and relevant parameters indicate that the Freundlich model provided the best fit, suggesting that U(Ⅵ) adsorption on T primarily occurs on heterogeneous surfaces with multiple adsorption active sites. This implies the presence of varying adsorption energies at different active sites and, in some instances, intermolecular interaction between U(Ⅵ) and T.
In the process of extracting U(Ⅵ), both the species of U(Ⅵ) and the surface charge of the material used for extraction are influenced by the pH [61]. Therefore, under the conditions of pH = 3-9, with an initial concentration of U(Ⅵ) at 100 mg/L, 20 mL, 20 mg, investigations were conducted into how the pH of the solution affected T's U(Ⅵ) extraction efficiency. From Fig. S13 (Supporting information), as the pH increased from 3 to 5, the adsorption capacity of T for U(Ⅵ) increased in the dark, subsequently stabilizing with further increases in pH. Subsequently, the reaction device underwent exposure to light. As illustrated in Fig. 4h, the concentration of U(Ⅵ) in the solution drops sharply after 20 min of illumination and stabilizes thereafter. The removal rates of U(Ⅵ) are 86.86%, 98.32%, 98.60% and 96.00%, respectively. This indicates that the solution pH has minimal effect on T's photocatalytic reduction performance of U(Ⅵ). T demonstrates excellent pH tolerance and high U(Ⅵ) removal efficiency across weakly acidic, neutral or weakly basic conditions. For most catalysts documented in studies, as shown in Table S7 (Supporting information), the photocatalytic reduction ability significantly decreases in weak acids or bases solutions. It is evident that T holds substantial photocatalytic reduction potential for U(Ⅵ). In order to validate the reusability of T sample, multiple adsorption-desorption experiments were performed. As shown in Fig. S14 (Supporting information), the U(Ⅵ) removal efficiency of T can remain steady after five cycles, which demonstrates the favorable reusability of T.
Photogenerated electrons are the primary drivers in the photocatalytic reduction of U(Ⅵ) by T. The photogenerated holes (h+) and electrons (e-) produced by the catalyst under visible light tend to recombine. As a result, h+ competes with U(Ⅵ) for electrons, thereby reducing the efficiency of T's photocatalytic reduction of U(Ⅵ). Therefore, the reaction system was conducted under a nitrogen atmosphere, and the influence of different hole trapping agents (CH3OH and CH3CH2OH) on the photocatalytic reduction U(Ⅵ) performance of T was investigated [62]. Fig. 4i shows that neither the presence nor the type of hole trapping agent significantly affects the excellent photocatalytic activity of T. This greatly reduces the operational cost of T's photocatalytic reduction of U(Ⅵ) and prevents secondary chemical pollution.
In summary, T exhibits strong adsorption and photocatalytic capabilities for U(Ⅵ). This can be attributed to the optimal {001}/{111} surface exposure ratio, the high specific surface area, and the abundant amino and carboxyl (-COOH) functional groups of T, which combined with uranyl ions through electrostatic attraction and chemical chelation.
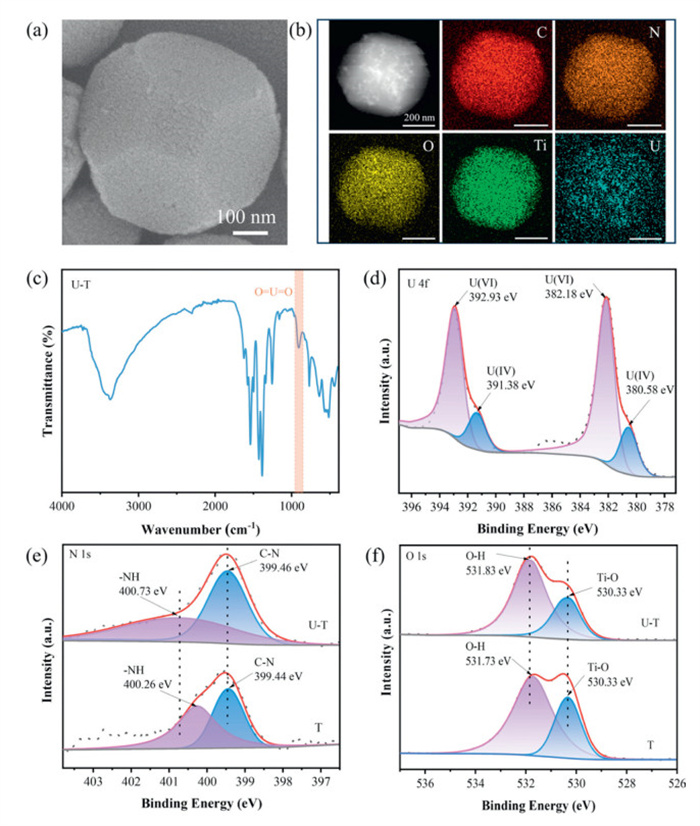
To investigate the mechanism of U(Ⅵ) extraction by the T sample, a series of characterizations were performed using SEM, PXRD, FT-IR and XPS. As shown in Fig. 5a and Fig. S15 (Supporting information), the morphology and crystal structure of the T sample after 2 h of continuous photocatalytic reaction did not significantly change compared to the pre-reaction state. The structural integrity of the T sample was well preserved after the photocatalytic reaction, indicating its superior structural stability during the reaction. Fig. 5c displays the FT-IR spectrum subsequent to U(Ⅵ) extraction, whereby a novel peak emerges at 907 cm-1, indicative of the asymmetric vibration of O = U = O [63,64]. Compared with before photocatalytic reaction, the peaks at 1625 cm-1 (N-H bending vibration) and 1427 cm-1 (asymmetric vibration of the carboxyl group) exhibited significant red shifts, while the peak at 1385 cm-1 (symmetrical vibration ofthe carboxyl group) exhibited a clear blue shift, confirming the occurrence of coordination chelation between these functional groups and U(Ⅵ) [65-67]. The SEM-EDS element mapping diagram (Fig. 5b) shows that, after the photocatalytic reaction, C, N, O and Ti elements are uniformly distributed on the surface of the T sample, with additional U elements present, further confirming U(Ⅵ) extraction. This was also confirmed by the total XPS spectra after photocatalysis (Fig. S16a in Supporting information). The high-resolution XPS spectra of U 4f (Fig. 5d) show that the U 4f5/2 peaks at 392.93 and 391.38 eV can be decomposed into two peaks corresponding to the binding energies of U(Ⅵ) and U(Ⅳ), respectively. The U 4f7/2 peaks at 382.18 and 380.58 eV can also be decomposed into two peaks corresponding to the binding energies of U(Ⅵ) and U(Ⅳ), respectively [14,68,69]. The surface of the T sample contains both U(Ⅵ) and U(Ⅳ) after the photocatalytic reaction. This indicates that two processes, adsorption and photocatalytic reduction of U(Ⅵ), occur in the T sample. First, U(Ⅵ) is adsorbed on the surface of the T sample under dark conditions, then part of U(Ⅵ) is reduced to U(Ⅳ) under light conditions. This is because illumination enhances the affinity of the active sites on the T sample for U(Ⅵ). Fig. 5e shows the high-resolution XPS spectrum of N 1s. After the photocatalytic reduction reaction, the -NH peak shifted by 0.47 eV toward higher binding energy, while the binding energy of the C-N peak remained largely unchanged, indicating that the T sample possessed abundant adsorption sites contributed by nitrogenous groups and that the -NH bond was involved in uranium coordination [54]. In the high-resolution O 1s XPS spectrum (Fig. 5f), the peak of O-H and Ti-O before the photocatalytic reaction were located at 531.73 and 530.33 eV, respectively. After the photocatalytic reaction, the O-H peak shifted to 531.83 eV, while the Ti-O peak remained largely unchanged due to the low concentration of U(Ⅳ). This can be attributed to the coordination bond between O-H and U(Ⅵ) [70]. Fig. S16b (Supporting information) shows a minimal shift in the O = C-O peak after the photocatalytic reduction reaction. Meanwhile, the XPS peak of Ti 2p3/2 shifted to 458.98 eV toward higher binding energy after the photocatalytic reaction (Fig. S16c in Supporting information). Based on these results, U(Ⅵ) forms bonds with O atoms surrounding the Ti atoms, causing shifts in the O = C-O and Ti peaks [48]. This further indicates the occurrence of a photocatalytic reduction reaction.
Figure 5
Figure 5.
(a) SEM of T after photoreduction of U(Ⅵ). (b) HAADF-STEM image and EDS mapping of T after photoreduction of U(Ⅵ). (c) FT-IR spectra of T after photoreduction of U(Ⅵ). (d) U 4f spectrum of T after uranium (Ⅵ) photoreduction. (e) XPS survey spectra of N 1s before and after photoreduction of U(Ⅵ). (f) XPS survey spectra of N 1s before and after photoreduction of U(Ⅵ).
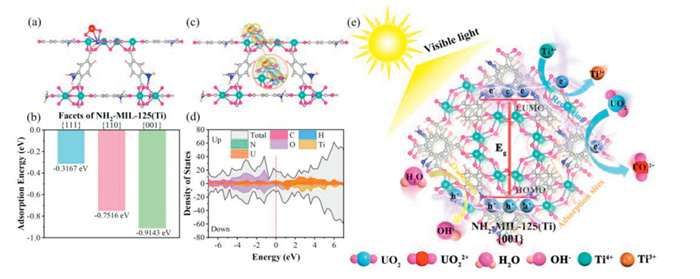
To further elucidate the uranium adsorption mechanism on various exposed facets of NH2-MIL-125(Ti), DFT calculations are conducted. The optimized geometric configurations of the [UO2]2+ moiety adsorbed on -NH and -COOH adsorption sites on the {001}, {111} and {110} facets of NH2-MIL-125(Ti) are shown in Fig. 6a and Fig. S17 (Supporting information). The [UO2]2+ moiety interacts with N and Ti on different facets of NH2-MIL-125(Ti), forming U-N, N-H and Ti-O-U bond, respectively. Meanwhile, the calculated adsorption energies of amino groups on the {001}, {111} and {110} facets of NH2-MIL-125(Ti) are −0.9143, −0.3167 and −0.7516 eV, respectively (Fig. 6b), indicating that [UO2]2+ is most strongly adsorbed by the amino group on the {001} facets. A similar conclusion is drawn from Fig. S18 (Supporting information), where the carboxyl group on the {001} facet of NH2-MIL-125(Ti) exhibits the largest adsorption energy for [UO2]2+. This further indicates that, compared to the {111} and {100} facets of NH2-MIL-125(Ti), the {001} facet possesses more adsorption sites (-NH and -COOH), thereby exhibiting superior adsorption capacity. In addition, to further understand why the {001} facets of NH2-MIL-125(Ti) exhibit the best adsorption performance of [UO2]2+, the charge density difference and electronic density of states (DOS) after the [UO2]2+ moiety adsorption on the {001} facets are investigated. The charge density difference (Fig. 6c and Fig. S19 in Supporting information) indicates that N and Ti atoms on the {001} facets of NH2-MIL-125(Ti) adsorb U(Ⅵ), accumulating electrons in the bonding region (U-N, N-H and Ti-O-U bond). This suggests that [UO2]2+ is firmly adsorbed by the -NH and -COOH sites on the {001} facets due to the strong interaction between [UO2]2+ and the {001} facets. As shown in Fig. 6d, a strong hybrid orbital forms between [UO2]2+ and N, indicating that during the adsorption process, electrons from N are transferred to [UO2]2+, allowing the {001} facets to stably adsorb [UO2]2+. The partial density of states (PDOS) for carboxyl adsorption sites on {111}, {110} and {001} facets of NH2-MIL-125(Ti) are shown in Fig. S20 (Supporting information). These results further demonstrate that the {001} facets, with its excellent adsorption ability, is key to promoting the photocatalytic reduction reaction. Since the average percentage of {001} facets in the T sample are higher than in the D sample, the T sample exhibits better adsorption-photocatalytic synergistic performance. Additionally, different morphologies/facets have distinct electronic band structures, leading to varying charge separation capabilities. A smaller the HOMO-LUMO gap facilitates the transition of photogenerated electrons from the HOMO to the LUMO energy level. As shown in Fig. 6e, under simulated illumination, the organic ligand NH2-BDC at the HOMO level absorbs visible light, generating photogenerated electrons and hole pairs (Eq. 1), where h+ oxidizes water to strongly reducing hydroxyl radicals (·OH) at the HOMO level (Eq. 2) [71], and an equal number of photogenerated electrons is transferred to the LUMO level. Since the LUMO energy level potential of NH2-MIL-125(Ti) is more negative than the U(Ⅵ)-to-U(Ⅳ) potential, Ti4+ in the metal-oxygen cluster is converted to Ti3+ with strong reducing properties (Eq. 3) [72]. Combined with the abundant amino groups and high specific surface area of the photocatalyst, which provide numerous active sites, U(Ⅵ) is adsorbed on the photocatalyst surface and reduced to U(Ⅳ) under light (Eqs. 4 and 5) [73]. In this process, the T sample with a suitable exposure ratio of the {001}/{111} facets efficiently inhibits the recombination of photogenerated electrons and holes. The {001} facets act as the transfer center of photogenerated electrons, further promoting charge separation and augmenting the photocatalytic efficiency of U(Ⅵ) reduction.
Figure 6.
(a) The adsorption configurations of amino groups on the {001} facet of NH2-MIL-125(Ti) for the adsorption of [UO2]2+; Carbon, oxygen, nitrogen, titanium, hydrogen and uranium atoms are depicted in brown, purple, dark blue, green, light pink and red, respectively. (b) Adsorption energies of amino groups on the {001} facets, {111} facets and {110} facets of NH2-MIL-125(Ti). (c) Charge density difference (isovalue of 0.004 e/Å3) after the [UO2]2+ moiety adsorption on the -NH site of {001} facets of NH2-MIL-125(Ti). Yellow and light blue, respectively, the electron accumulation and depletion, respectively. (d) Partial density of states (PDOS) of {001} facets of NH2-MIL-125(Ti). (e) The possible mechanism of U(Ⅵ) photoreduction over {001} facets of NH2-MIL-125(Ti).
In summary, four variants of NH2-MIL-125(Ti) with distinct facets were synthesized through controlled reactant concentrations and DMF/MeOH ratio adjustments. This allowed precise control over the exposed active facets and a systematic investigation into their effects on the adsorption-photoreduction synergy for U(Ⅵ). NH2-MIL-125(Ti) adsorbs U(Ⅵ) in the dark and converts it to insoluble U(Ⅳ) under visible light. The T sample, with a high ratio of exposed {001} facets, exhibits superior synergistic uranium extraction performance, removing over 97% of U(Ⅵ) within 20 min of visible light irradiation across various concentrations and pH values, without requiring a hole trapping agent. The synergistic performance is enhanced through precise facet regulation, increasing the specific surface area and adsorption energy for U(Ⅵ) while boosting photocatalytic activity by facilitating electron migration and reducing electron-hole recombination. Overall, this study revealed the role of morphology and facets in enhancing the adsorption-photocatalytic synergy of NH2-MIL-125(Ti), providing insights into the design of MOF catalysts to optimize uranium extraction by tailoring active facets.
Declaration of competing interest
The authors declare that they have no known competing financial interests or personal relationships that could have appeared to influence the work reported in this paper.
This study was supported by the National Natural Science Foundation of China (NSFC, Nos. U1904215, 52371240, 22305212), the Program for Young Changjiang Scholars of the Ministry of Education, China (No. Q2018270).
Supplementary materials
Supplementary material associated with this article can be found, in the online version, at doi:10.1016/j.cclet.2024.110733.
[1]
Y.J. Lim, K. Goh, A. Goto, Y. Zhao, R. Wang, J. Mater. Chem. A 11 (2023) 22551–22589. doi: 10.1039/d3ta05099h
[2]
Z. Niu, Z. Fan, T. Pham, et al., Angew. Chem. Int. Ed. 61 (2022) e202117807. doi: 10.1002/anie.202117807
Figure 1
(a) Schematic diagram for the preparation of NH2-MIL-125 samples. SEM images of as-synthesized (b) W, (c) T, (d) D, (e) S and (f) M. TEM images of (g) W, (h) T, (i) D, (j) S and (k) M. (l) HAADF-STEM image and EDS mapping of T.
Figure 3
(a) UV–vis DRS spectra. (b) Band gap of M, W, T, D and S. (c) Transient photocurrent responses. (d) Steady PL spectra under 320 nm excitation. (e) Mott-Schottky plots in a 0.2 mol/L Na2SO4 aqueous solution (pH 6.8). (f) HOMO-LUMO gap of the as-synthesized photocatalysts.
Figure 4
(a) Photocatalytic removal of U(Ⅵ) by M and NH2-MIL-125(Ti) with different morphologies. Photocatalytic reaction conditions: [U(Ⅵ)] initial = 100 mg/L, V = 20 mL, m = 20 mg, pH 7. (b) Pseudo-first-order kinetic model and (c) pseudo-second-order kinetic model with the above samples. (d) Effect of U(Ⅵ) concentration, V = 20 mL, m = 20 mg, pH 7. (e) Pseudo-second-order model of U(Ⅵ) reduction at different initial U(Ⅵ) concentration (25–250 mg/L), V = 20 mL, m = 20 mg, pH 7. (f) Langmuir model. (g) Freundlich model. (h) Photocatalytic removal of U(Ⅵ) by T under different pH values. Photocatalytic reaction conditions: [U(Ⅵ)] initial = 100 mg/L, V = 20 mL, m = 20 mg. (i) Photocatalytic removal of U(Ⅵ) by T under kinds of hole trapping agent. Photocatalytic reaction conditions: [U(Ⅵ)] initial = 100 mg/L, V = 20 mL, m = 20 mg, pH 7.
Figure 5
(a) SEM of T after photoreduction of U(Ⅵ). (b) HAADF-STEM image and EDS mapping of T after photoreduction of U(Ⅵ). (c) FT-IR spectra of T after photoreduction of U(Ⅵ). (d) U 4f spectrum of T after uranium (Ⅵ) photoreduction. (e) XPS survey spectra of N 1s before and after photoreduction of U(Ⅵ). (f) XPS survey spectra of N 1s before and after photoreduction of U(Ⅵ).
Figure 6
(a) The adsorption configurations of amino groups on the {001} facet of NH2-MIL-125(Ti) for the adsorption of [UO2]2+; Carbon, oxygen, nitrogen, titanium, hydrogen and uranium atoms are depicted in brown, purple, dark blue, green, light pink and red, respectively. (b) Adsorption energies of amino groups on the {001} facets, {111} facets and {110} facets of NH2-MIL-125(Ti). (c) Charge density difference (isovalue of 0.004 e/Å3) after the [UO2]2+ moiety adsorption on the -NH site of {001} facets of NH2-MIL-125(Ti). Yellow and light blue, respectively, the electron accumulation and depletion, respectively. (d) Partial density of states (PDOS) of {001} facets of NH2-MIL-125(Ti). (e) The possible mechanism of U(Ⅵ) photoreduction over {001} facets of NH2-MIL-125(Ti).

 DownLoad:

 下载:
下载:


 下载:
下载:
