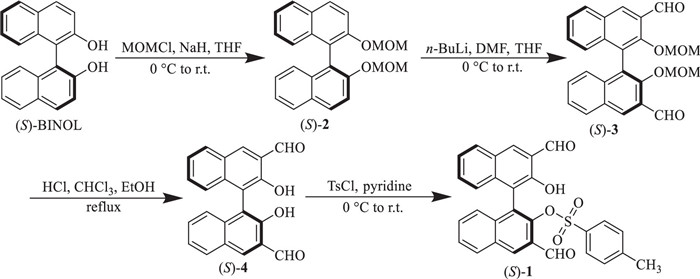
Scheme 1.
Synthesis of (S)−1.
A chiral fluorescent probe for molecular recognition of basic amino acids in solutions and cells
Chuan-Zhi Ni , Ruo-Ming Li , Fang-Qi Zhang , Qu-Ao-Wei Li , Yuan-Yuan Zhu , Jie Zeng , Shuang-Xi Gu

Chiral amino acids as the basic units of enzymes, peptides, antibodies, receptors, and signaling molecules in living organisms play important roles in biological functions [1-3]. Among the 19 common chiral amino acids, there are 3 basic ones, including lysine (Lys), arginine (Arg), and histidine (His), which have been found to have diverse biological functions and physiological effects [4-6]. For a long time, it had been believed that amino acids in nature exist in their L-enantiomers. However, an increasing number of studies had revealed that the pathogenesis of some diseases, such as neurological disorders, chronic kidney disease, cataract and so on, were related to the emergence of D-amino acids in vivo [7-10]. Thus, recognition and detection of D-enantiomers of amino acids in cells and organisms are of great significance for the development of new diagnosis and treatment techniques for these diseases. Meanwhile, single enantiomers of basic amino acids have been extensively applied in chiral materials [11,12], pharmaceuticals [13-15], and precursors or ligands for asymmetric synthesis [16,17]. Therefore, it is significant to discriminate these three basic amino acids and recognize their enantiomers in both solutions and cells.
Fluorescent probes as one of the molecular recognition methods, have the advantages of easily available equipment, high sensitivity, and real-time imaging [18-21]. Meaningful researches have been conducted on the development of fluorescent probes for chemoselective or enantioselective recognition of amino acids in recent years [22-25]. 1,1′-Bi-2-naphthol (BINOL) as an axially chiral molecule has been widely used in chiral fluorescent probes for its tunable structure and excellent fluorescence properties [26,27]. It has been reported that the BINOL-based chiral aldehyde combining with Zn2+ showed enantioselective fluorescent responses toward certain amino acids [28]. We previously developed structurally diverse BINOL-based fluorescent probes, which possessed high enantioselectivity toward various free amino acids in organic phase, fluorine phase and water [29-31]. However, the chemoselective discrimination of all the 3 basic amino acids from 19 common chiral amino acids is a challenging work and has been rarely reported. Furthermore, to the best of our knowledge, there is no report about the enantioselective recognition of basic amino acids in both solutions and cells.
In this work, we designed a novel 2-tosyl-substituted BINOL-based probe (S)−1 (Scheme 1), which was originally aimed at improving the specificity of molecular recognition to amino acids through nucleophilic substitution of 2-tosyl with -NH2 from chiral substrates. However, we found that 2-tosyl was not removed through the results of 1H nuclear magnetic resonance (1H NMR) and high resolution mass spectra (HR-MS) of the reaction mixtures [(S)−1 + Zn2+ + L-/D-amino acid]. To our surprise, the probe only showed prominent fluorescent enhancement toward 3 basic amino acids among 19 common chiral amino acids, and also displayed high enantioselectivity to His in both solutions and cells. More encouragingly, enantioselective imaging of His in cells was achieved for the first time by the probe (S)−1. These endowed its potential application for diagnosis of diseases caused by racemization of His.
As depicted in Scheme 1, (S)−1 was prepared from readily available (S)-BINOL through four-step reactions. Firstly, (S)-BINOL was protected by chloromethyl methyl ether (MOMCl) to obtain intermediate (S)−2. (S)−2 underwent a formylation reaction by sequential treatment with n-butyllithium and N,N-dimethylformamide (DMF) to obtain the intermediate (S)−3, which was subsequently deprotected in concentrated hydrochloric acid to give intermediate (S)−4. Then, (S)−4 was esterified with p-tosyl chloride in pyridine to obtain the probe (S)−1. The enantiomer (R)−1 was synthesized in the same method from (R)-BINOL. Detailed synthetic procedures and characterizations were provided in Supporting information.
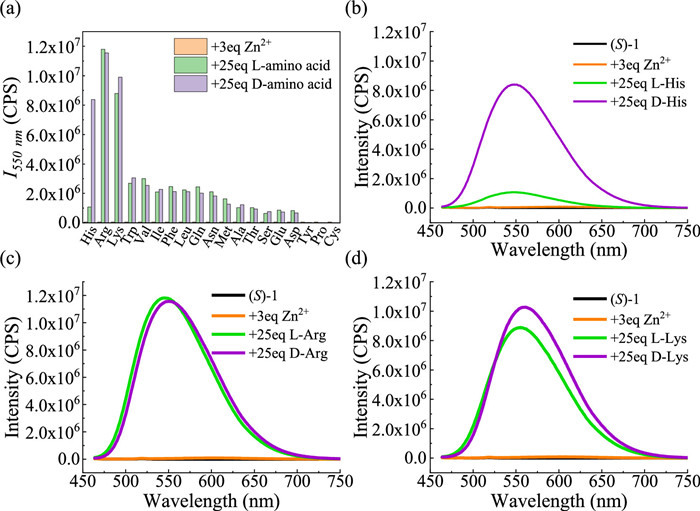
The synthesized probe (S)−1 exhibited no fluorescence in common water-miscible organic solvents. Firstly, we studied the fluorescent responses of (S)−1 to 19 pairs of common chair amino acids in DMSO/H2O (39/1, v/v) in the presence of Zn2+. As shown in Fig. S1 (Supporting information), for the reaction between (S)−1 and Zn2+, inconspicuous fluorescent response occurred at 600 nm. Followed by treatment with different amino acids, fluorescence enhanced in different degrees at the range of 500–650 nm, except to Tyr, Pro and Cys. The intensity at 550 nm for all of the 19 pairs chiral amino acids were plotted as column charts in Fig. 1a. It is worth noting that the fluorescence intensity of the three basic amino acids, including His, Arg and Lys, was remarkably stronger than that of the other 16 amino acids. Furthermore, (S)−1 displayed excellent enantioselective fluorescent enhancement toward His. The fluorescent response to these three basic amino acids were shown in Figs. 1b–d. Moreover, the ultraviolet–visible (UV–vis) absorption spectra of (S)−1 + Zn2+ treated by L- and D-His were also studied to help us to understand the photophysics of the recognition process. As shown in Fig. S2 (Supporting information), addition of L- or D-His led a greatly increased absorption at 434 nm, which could be attributed to the π-π conjugation of the naphthyl ring and the new formed imine group.
We also studied the fluorescent response of (R)−1, the enantiomer of (S)−1, toward the above 19 pairs amino acids at the same conditions. The fluorescent spectra and the column charts of the intensity at 550 nm were shown in Figs. S3 and S4 (Supporting information), respectively. The results were similar to that of (S)−1. The outstanding fluorescent enhancement occurred on the three basic amino acids, among which, the prominent enantioselective fluorescent enhancement happened for His. Meanwhile, the mirror relationship was found for the fluorescent response of enantiomer pairs of probe toward D-/L-His, which can be seen from Fig. 1b and Fig. S3a. The results confirmed that the 2-tosyl-substituted BINOL-based probe could be used not only for chemoselective discrimination basic amino acids out of common amino acids, but also for enantioselective recognition of His.
And also, we synthesized a contrast compound (S)−5 featuring a 2-mesyl group according to the description in Supporting information, and conducted the study on its fluorescent response to 19 amino acids under the same conditions in Fig. 1. As shown in Fig. S5 (Supporting information), the results were similar to that of (S)−1. The prominent fluorescent enhancement only occurred on the three basic amino acids and also presented excellent enantioselectivity toward His. However, the fluorescence intensity was only about one-third of that for (S)−1 treated with the three basic amino acids. It suggested that the chemoselective recognition ability of (S)−1 or (S)−5 toward basic amino acids might be related with the sulfonate group, and the benzene ring of 2-tosyl group in (S)−1 increased the molecular rigidity which brought stronger fluorescence intensity.
In addition, we investigated the effect of metal ions on the fluorescent response of probe (S)−1 toward above three basic amino acids. Under the same conditions, Zn2+, Mg2+, Li+, Ni2+, Cu2+, Fe2+ and Fe3+ were respectively added into the mixtures of (S)−1 and amino acids, and their fluorescent responses were shown in Figs. S6–S8 (Supporting information), corresponding to His, Arg and Lys. For these three amino acids, the studied metal ions, except for Zn2+ or Mg2+, cannot make (S)−1 exhibit obvious fluorescent enhancement toward their enantiomers. And for His, comparing with Mg2+, Zn2+ induced much stronger fluorescent intensity and more excellent enantioselectivity. For Arg and Lys, it is still the Zn2+ that can make (S)−1 present stronger fluorescent response to them. Therefore, among these studied metal ions, Zn2+ is the most appropriate participant in chemoselecive recognition of these three basic amino acids and enantioselective recognition of His. Subsequently, we carried out the further study on the enantioselectivity of the probe to His in the presence of Zn2+.
The influence of the amount of Zn2+ on the enantioselectivity of (S)−1 toward His was investigated. Fig. S9 (Supporting information) showed that although the enantioselective fluorescent enhancement happened at the absence of Zn2+, the fluorescent intensity was too weak for accurate detection. With the addition of Zn2+, the fluorescent response of (S)−1 toward two enantiomers of His were both strengthened, and significantly stronger fluorescence was exhibited in the mixture containing D-His than that containing L-His. The column charts of fluorescence intensity at 550 nm under different equivalents of Zn2+ were plotted in Fig. 2, and the enantioselective fluorescent enhancement ratio [ef = (ID − I0)/(IL − I0)] versus Zn2+ amounts was also shown in Fig. S10 (Supporting information). It could be seen that the excellent enantioselectivity with ef value over 10 was obtained in the whole studied Zn2+ equivalent range of 0.1–8.0. And the fluorescent intensity to D-His increased obviously with the rising of Zn2+ equivalent among 0.1–1.5, then kept negligible change in the range of 1.5–8.0 equiv. Based on these results, when the fluorescent probe (S)−1 being applied in the chiral recognition of His, addition of Zn2+ with the equivalent of 1.5–8.0 was necessary.

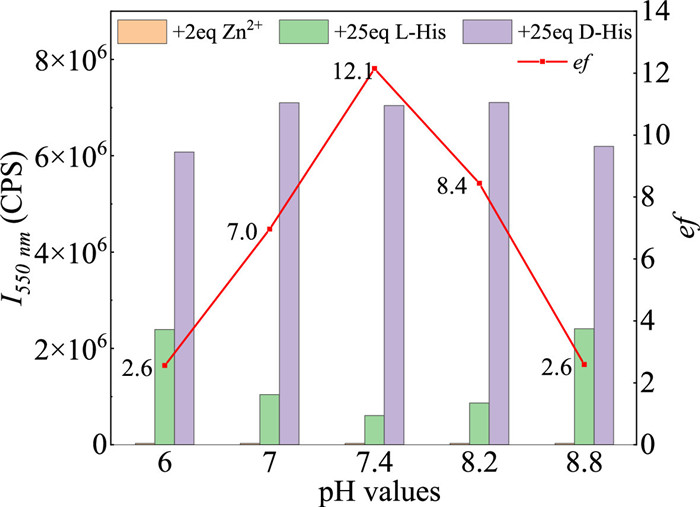
As well known, effect of solvent on fluorescence cannot be ignored. Therefore, the fluorescent response of (S)−1 toward His was studied in several water-miscible solvents including DMSO, DMF, EtOH, MeOH, CH3CN and THF, and the results were shown in Fig. S11 (Supporting information). Except for CH3CN and THF, the probe displayed outstanding enantioselectivity toward His in other four solvents, including protic solvents of EtOH, MeOH and aprotic solvents of DMSO, DMF. It has been reported that in the molecular recognition of chiral amines, the enantioselectivity of BINOL-based fluorescent probes is dependent on the pH value of the chiral amine solutions. Most of the probes only displayed good enantioselectivity toward amines in alkaline conditions [28-31], which limited its application in alkaline-repellent environment, such as in cell or in vivo imaging. In order to explore the suitable pH value range for the probe, we tried to dissolve D-/L-His in the buffer solutions with pH values of 6, 7, 7.4, 8.2 and 8.8, respectively. And then the probe solutions containing Zn2+ were treated with each of the above His solutions. Fig. 3 showed the fluorescence intensity at 550 nm and the ef values versus the pH values, fluorescent spectra were shown in Fig. S12 (Supporting information). It was found that (S)−1 displayed good enantioselectivity toward His under all the five pH values, and the ef value reached 12.1 at pH 7.4.
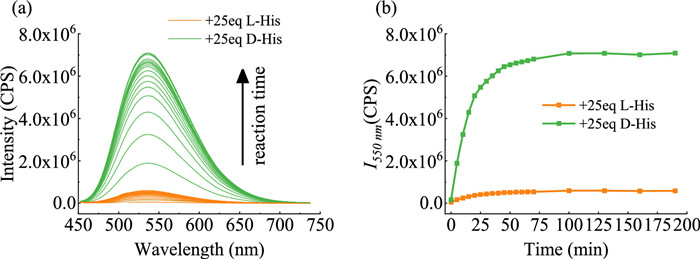
The above results indicated that the fluorescent probe (S)−1 possessed good performance on chiral recognition of His in diversified solvents and wide pH range. Then the fluorescent response time and stability of the probe to His were investigated under the conditions of DMSO/H2O and pH 7.4. We recorded the fluorescent response of the mixtures of (S)−1 (25 µmol/L), D-/L-His and Zn2+, which were allowed to stand at 25 ± 0.5 ℃ for different time. The fluorescence spectra and the peak intensity versus standing time were plotted in Fig. 4. When (S)−1 + Zn2+ being treated with L-His, there was no obvious fluorescent enhancement in the whole studied standing time. However, when treated with D-His, the fluorescence intensity linearly increased with time in the first 25 min, then the enhancement trend became mild in the following time. The fluorescence intensity approached the maximum at 50 min, and maintained stable for 50–190 min. This indicated that the chirality-sensitive fluorescent response of the probe for enantioselective recognition of His was time-saving. In addition, good fluorescence stability also endowed the probe a great advantage in the chiral recognition of amino acids.
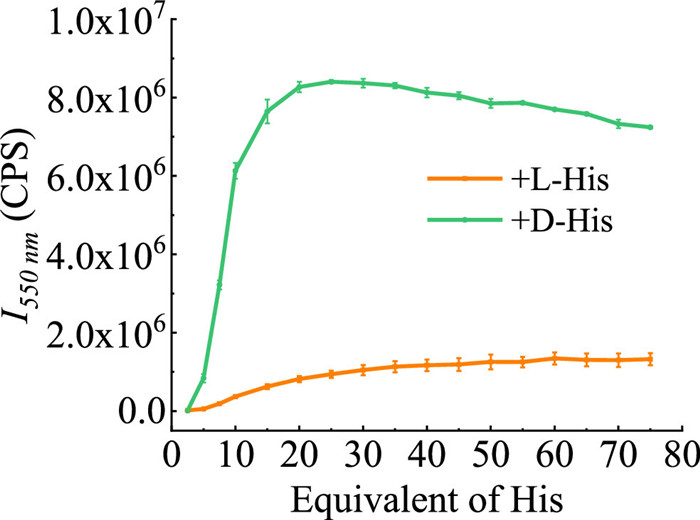
Subsequently, the dependence of His amount on fluorescence intensity was studied. As shown in Fig. 5, the fluorescence intensity at 550 nm strengthened dramatically with the increasing of D-His equivalent in the range of 2.5–15 equiv., and reached its maximum at 25 equiv. On the contrary, the increasing trend of fluorescence intensity with the rising of L-His amount was not obvious, and the fluorescence remained weak in the range of 2.5–75 equiv. When the amount of D-His was over 25 equiv., the fluorescence decreased slightly, which could be attributed to the reaction equilibrium and the self-quenching of fluorescence due to high concentration. While the equivalent of L-His was over 25, the fluorescence kept slowly increasing, which indicated that the reaction between (S)−1 + Zn2+ and L-His still did not reach its equilibrium at this condition. The fluorescence spectra of all the mixtures of (S)−1, Zn2+ and L-/D-His were shown in Fig. S13 (Supporting information). Furthermore, the relationship of His equivalent and fluorescence intensity of (R)−1 was also studied under the same conditions (Fig. S14 in Supporting information). The results were opposite to that of (S)−1. The enhancement trend of fluorescence intensity with the increasing of L-His equivalent was much greater than that with D-His, and the fluorescence intensity to D-His remained weak in the studied equivalent range. Significantly, the maximum of fluorescence intensity for (R)−1 toward L-His also appeared at 25 equiv.
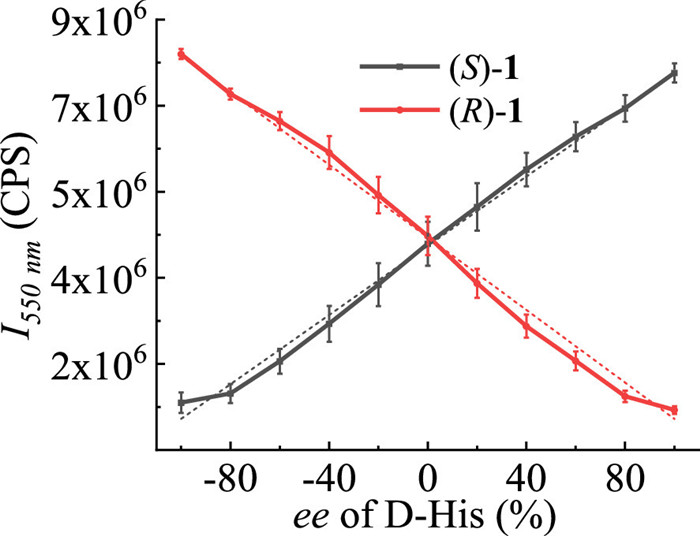
Then the relationship between the fluorescence intensity and the enantiomeric composition was investigated under the condition of 25 equiv. His. The enantiomer pairs, (S)−1 and (R)−1, were both used to react with His with different enantiomeric excess [ee = ([D] − [L])/([D] + [L])]. The fluorescent response of (S)−1 and (R)−1 toward His with different ee values were shown in Fig. S15 (Supporting information), and the fluorescence intensity at 550 nm versus the ee values were plotted in Fig. 6. The linear relationships between fluorescence intensity and ee values were found for both of (S)−1 and (R)−1, and the fitted linear equations were as follows: yS = 36,202x + 4,270,172 (R2 = 0.9950, yS is I550 of (S)−1, x is ee value, Eq. Ⅰ); yR = −37,961, x + 4,446,647 (R2 = 0.9962, yR is I550 of (R)−1, x is ee value, Eq. Ⅱ). It also can be seen that these two fitted lines showed excellent mirror relationship. Therefore, both of (S)−1 and (R)−1 had the potential to determine the ee values of His. Next, we prepared His solutions with designed ee values, then added them to the mixtures of (S)−1 + Zn2+ and (R)−1 + Zn2+, respectively. The fluorescence intensity at 550 nm (Table S1 in Supporting information), which was recorded under the same conditions of Fig. 6, was substituted into Eqs. Ⅰ and Ⅱ to calculate the ee values, respectively. The actual ee, calculated ee and absolute errors were all listed in Table 1. All the absolute errors of the calculated ee to their corresponding actual values were less than 10.5 %. These results demonstrated the feasibility of determining the His enantiomeric compositions via the probes (S)−1 or (R)−1.
 DownLoad:
CSV
DownLoad:
CSV

|
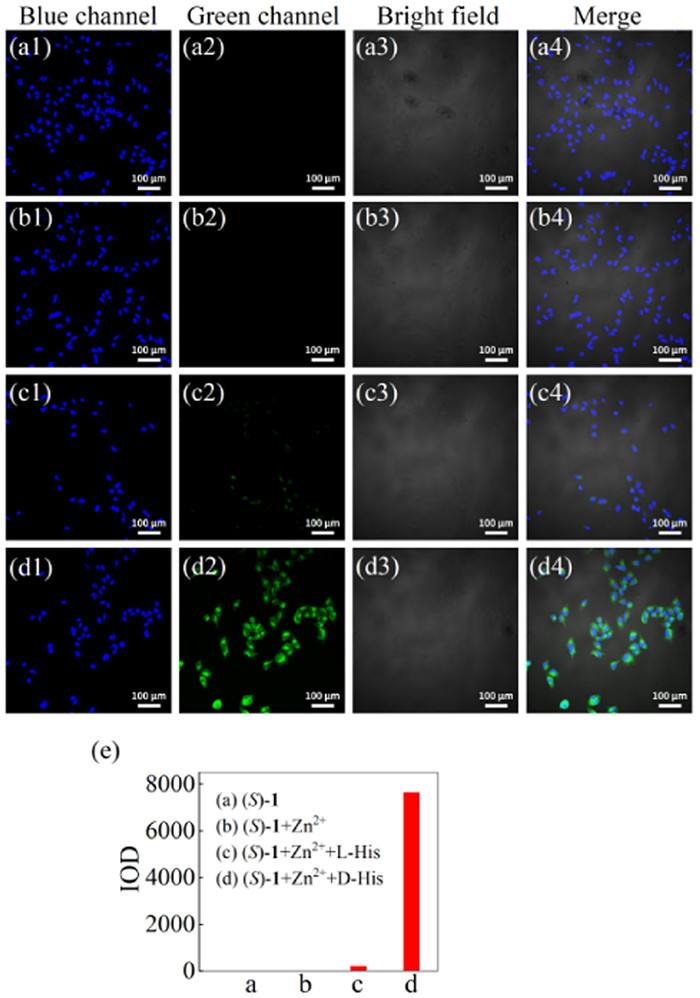
Although the enantioselective fluorescent imaging of amino acids in cells was significant for biological analysis and potential disease diagnosis, scarcely any advance was achieved for basic amino acids in the past decades. In our following work, we carried on the enantioselective fluorescent imaging of His in cells. Cytotoxicity of (S)−1 was assessed by performing cell counting kit-8 (CCK-8) assay with the HeLa cells (as described in Supporting information). The results demonstrated that (S)−1 has low toxicity in living cells and it serves as a safe probe for application in biological systems (Fig. S16 in Supporting information). Enantioselective fluorescent imaging results were displayed in Figs. 7a–d. Photos from left to right are imaging in blue channel, green channel, bright field and merged field. And the blue signal was from the dye of 4′,6-diamidino-2-phenylindole dihydrochloride (DAPI), which was used to facilitate cell localization under the microscope. The HeLa cells showed almost no green fluorescence when only incubated with probe (S)−1 or with (S)−1 and Zn2+, and when incubated with L-His, Zn2+ and (S)−1, only very week green fluorescence could be found. Conversely, upon incubating with D-His, Zn2+ and (S)−1, much stronger green fluorescence was observed obviously. The relative intensity of green fluorescence signal was calculated by imageJ software and shown in Fig. 7e. The integrated optical density (IOD) of HeLa cells incubated with D-His was 33 times stronger than that of cells incubated with L-His. This result indicated that the probe (S)−1 performed outstanding enantioselective fluorescence imaging of His in cells.
In order to get better understanding on the enantioselective fluorescent response of (S)−1 toward His, we conducted investigations on the 1H NMR, HR-MS and the thermodynamic stability calculations by Gaussian 16 program.
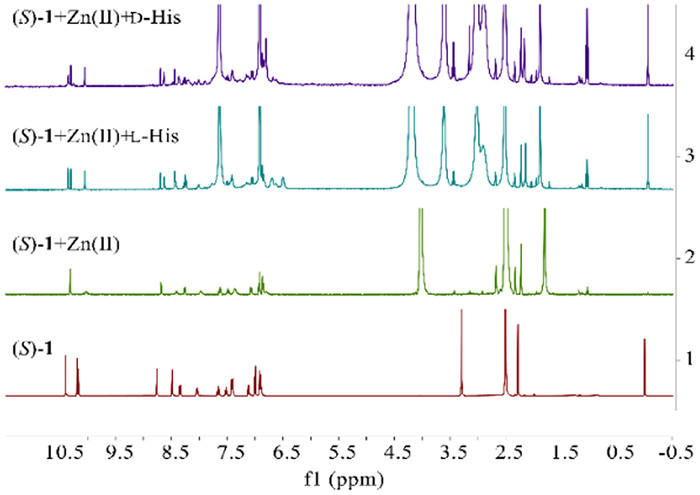
Fig. 8 showed the 1H NMR results of (S)−1, (S)−1 + Zn2+, (S)−1 + Zn2+ + L-His and (S)−1 + Zn2+ + D-His. (S)−1 gave six singlets at δ 10.40, 10.20 for its two aldehyde protons, δ 10.18 for its hydroxy proton, δ 8.77, 8.49 for the two naphthyl proton ortho to the two aldehyde groups, and δ 2.28 for methyl proton of 2-tosyl group, respectively (line 1). When Zn2+ was added, the hydroxyl proton signal at δ 10.18 disappeared due to deuteration, and also the signal for one of the aldehyde protons at δ 10.20 and one of the naphthyl proton ortho to aldehyde groups at δ 8.49 became weak (line 2). It indicated the strong interaction between (S)−1 and Zn2+. After adding L- or D-His, the aldehyde proton signal at δ 10.40 weakened and a new peak at δ 10.36 appeared adjacently (lines 3 and 4). It could be inferred that the probe (S)−1 and the product of (S)−1 + Zn2+ + L-/D-His both existed in the mixture, and only one of the two aldehyde groups of the probe molecule participated in the reaction with amino acids. The singlets at δ 10.40 and 10.36 were for the unreacted aldehyde protons coming from (S)−1 and the product, respectively. It also could be seen that intensity ratio of δ 10.40 to 10.36 for the mixture containing D-His (line 4) was obvious lower than that of the mixture containing L-His (line 3), which indicated that the reaction extent of (S)−1 and D-His was larger than that of (S)−1 and L-His. Furthermore, the singlet at δ 2.28 for methyl proton of 2-tosyl group remained unchanged after reaction with L- or D-His (the new singlet at δ 2.23 adjacent to δ 2.28 was from the piperazine ring of HEPES).
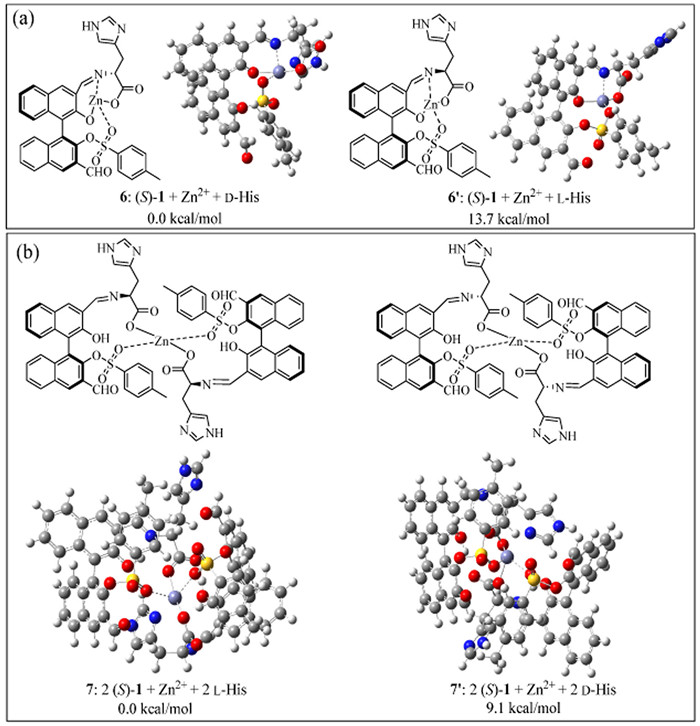
As shown in Fig. S17a (Supporting information), in the HR-MS result for the reaction of (S)−1 + Zn2+ with D-His, a signal at m/z = 696.0772 was observed, which could be attributed to the complex 6 (Fig. 9a, calcd. for [6 + H]+ is 696.0705). And for another reaction with L-His in the same conditions, a signal at m/z = 1329.3392 was found (Fig. S17b in Supporting information), which could be ascribed to complex 7 (Fig. 9b, calcd. for [7 + H]+ is 1329.2274). The molecular modeling structures and thermodynamic stability of 6 formed from D-His, its analogue 6′ formed from L-His, 7 formed from L-His and its analogue 7′ formed from D-His were investigated based on density functional theory (DFT) calculations by Gaussian 16 program (Fig. 9). The total energy of 6 is 13.7 kcal/mol lower than 6′, and the total energy of 7 is 9.1 kcal/mol lower than 7′. Furthermore, the molecular structure of the complex 6 also showed that the sulfonyl oxygen atom of the probe was close to the proton of -NH- in the imidazole ring of D-His with the distance of 6.41303 Å, and there might be a weak interaction between them. While in the molecular structure of another complex 6′, the distance between the two was 8.80166 Å, which was longer than in the complex 6. The interaction between the sulfonate group of the probe and the residual amino group of His was also likely to participate in the chiral recognition process. It could be inferred that the chemoselective recognition of basic amino acids out of other common amino acids by the probe might be ascribed to the sulfonate group in the probe providing the interaction site with the residual amino group of basic amino acids. In addition, His with an imidazole ring has a larger steric hindrance than Arg and Lys when approaching the chiral recognition pocket of the probe, thus only its chiral matching enantiomer could interact with probe to form a stable molecular structure such as 6, which brought the enantioselective fluorescence response.
Combining the above results of 1H NMR, HR-MS and DFT calculation, the different reaction extent of the probe molecule with the amino acid enantiomers, and the different product structures induced the enantioselective fluorescent response.
In conclusion, a novel fluorescent probe (S)−1 showed obvious fluorescent enhancement toward three basic amino acids including Arg, Lys and His. (S)−1 could chemoselectively recognize them out of 19 common chiral amino acids. Furthermore, it also exhibited outstanding enantioselective fluorescent response toward His in diverse solvents and a wide pH value range. These advantages endowed it great application potentials in enantioselective recognition of His in both solutions and cells. And the enantioselective fluorescent imaging of His was firstly achieved in the HeLa cells through the probe (S)−1. Results of 1H NMR, HR-MS and DFT calculation indicated that the different reaction extent of probe molecule with the amino acid enantiomers, and the different product structures induced the enantioselective fluorescent response. The probe (S)−1 could promote the chiral analysis of basic amino acids in asymmetric synthesis and cell imaging.
The authors declare that they have no known competing financial interests or personal relationships that could have appeared to influence the work reported in this paper.
Chuan-Zhi Ni: Data curation, Investigation, Writing – original draft. Ruo-Ming Li: Data curation, Investigation. Fang-Qi Zhang: Data curation. Qu-Ao-Wei Li: Data curation. Yuan-Yuan Zhu: Conceptualization, Funding acquisition, Supervision, Writing – review & editing. Jie Zeng: Investigation, Validation, Writing – review & editing. Shuang-Xi Gu: Conceptualization, Funding acquisition, Supervision, Writing – review & editing.
The financial support from the National Natural Science Foundation of China (Nos. 22074114, 22377097, 21877087), Natural Science Foundation of Hubei Province of China (Nos. 2020CFB623, 2021CFB556), Engineering Research Center of Phosphorus Resources Development and Utilization of Ministry of Education (No. LCX202305), Wuhan Institute of Technology Graduate Education and Teaching Reform Research Project (Nos. 2022JYXM09, 2021JYXM07) and Wuhan Institute of Technology Graduate Innovation Fund (No. CX2022450) are greatly appreciated. We also acknowledge Jia-Yang Pan, Gan Wang and Song Lv (Nanjing Pusheng Biomedical Co., Ltd.) for the work in the experiments of cell imaging.
Supplementary material associated with this article can be found, in the online version, at doi:
T. Vellai, Nature 596 (2021) 192–194. doi: 10.1038/d41586-021-01943-7
S.F. Oh, T. Praveena, H. Song, et al., Nature 600 (2021) 302–307. doi: 10.1038/s41586-021-04083-0
S.X. Gu, H.F. Wang, Y.Y. Zhu, et al., Pharm. Front. 2 (2020) e79–e87. doi: 10.1055/s-0040-1713820
J. Gambardella, W. Khondkar, M.B. Morelli, et al., Biomedicines 8 (2020) 277. doi: 10.3390/biomedicines8080277
N. Kanarek, H.R. Keys, J.R. Cantor, et al., Nature 559 (2018) 632. doi: 10.1038/s41586-018-0316-7
A. Pinson, L. Xing, T. Namba, et al., Science 377 (2022) abl6422. doi: 10.1126/science.abl6422
G. Murtas, L. Pollegioni, Int. J. Mol. Sci. 24 (2023) 3274. doi: 10.3390/ijms24043274
M. Abdulbagi, L. Wang, O. Siddig, et al., Biomolecules 11 (2021) 1716. doi: 10.3390/biom11111716
J.J.A.J. Bastings, H.M. Van Eijk, S.W. Olde Damink, et al., Nutrients 11 (2019) 2205. doi: 10.3390/nu11092205
Y. Shi, Z. Hussain, Y. Zhao, Int. J. Mol. Sci. 23 (2022) 10794. doi: 10.3390/ijms231810794
F. Nie, K.-Z. Wang, D. Yan, Nat. Commun. 14 (2023) 1654. doi: 10.1038/s41467-023-37331-0
J. Cai, A.A. Liu, X.H. Shi, et al., J. Am. Chem. Soc. 145 (2023) 24375–24385. doi: 10.1021/jacs.3c09448
R. Izzo, V. Trimarco, P. Mone, et al., Pharmacol. Res. 183 (2022) 106360. doi: 10.1016/j.phrs.2022.106360
A. Bongioanni, M.S. Bueno, B.A. Mezzano, et al., Int. J. Pharm. 613 (2022) 121375. doi: 10.1016/j.ijpharm.2021.121375
S. Mandal, S. Mallik, A. Bhoumick, et al., ChemBioChem (2024) e202300834.
M.S. Roy, X.F. Meng, K. Koda, et al., Org. Biomol. Chem. 21 (2023) 1422–1434. doi: 10.1039/d2ob01908f
Y. Ke, J. Zhao, U.H. Verkerk, et al., J. Phys. Chem. B 111 (2007) 14318–14328. doi: 10.1021/jp0746648
B.M. Paget, K.V. Ram, S.Y. Zhang, et al., Sensor. Actuat. B: Chem. 400 (2024) 134828. doi: 10.1016/j.snb.2023.134828
M. Xie, J. Chen, Y. Wang, et al., Chin. Chem. Lett. 35 (2024) 108575. doi: 10.1016/j.cclet.2023.108575
H. Niu, J. Liu, H.M. O’Connor, et al., Chem. Soc. Rev. 52 (2023) 2322–2357. doi: 10.1039/d1cs01097b
Y. Xu, C. Li, S. Lu, et al., Nat. Commun. 13 (2022) 2009. doi: 10.1080/13658816.2022.2048834
L. Pu, Chem. Commun. 58 (2022) 8038–8048. doi: 10.1039/d2cc02363f
J. Li, N. Du, R. Guan, et al., ACS Appl. Mater. Interface. 15 (2023) 23642–23652. doi: 10.1021/acsami.3c02423
J. Yang, L. Jiang, J. Tian, S, et al., Org. Lett. 24 (2022) 9327–9331. doi: 10.1021/acs.orglett.2c03962
Y. Mao, E. Thomae, S. Davis, et al., Org. Lett. 25 (2023) 2157–2161. doi: 10.1021/acs.orglett.3c00692
L. Pu, Acc. Chem. Res. 45 (2012) 150–163. doi: 10.1021/ar200048d
J.M. Brunel, Chem. Rev. 105 (2005) 857–898. doi: 10.1021/cr040079g
Z. Huang, S. Yu, K. Wen, et al., Chem. Sci. 5 (2014) 3457–3462. doi: 10.1039/C4SC00818A
Y.Y. Zhu, X.D. Wu, S.X. Gu, et al., J. Am. Chem. Soc. 141 (2019) 175–181. doi: 10.1021/jacs.8b07803
Y.Y. Zhu, X.D. Wu, M. Abed, et al., Chem. Eur. J. 25 (2019) 7866–7873. doi: 10.1002/chem.201900880
M.X. Sun, C.Z. Ni, F.Q. Zhang, et al., Chin. Chem. Lett. 34 (2023) 108345. doi: 10.1016/j.cclet.2023.108345

Figure 1 (a) Column charts of fluorescence intensity at 550 nm of (S)−1 (25 µmol/L in DMSO, 1 equiv.) + Zn2+ (in H2O, 3 equiv.) treated by 19 pairs amino acids (in pH 7.4 HEPES buffer, 25 equiv.); fluorescence response towards three basic amino acids of (b) His, (c) Arg and (d) Lys (λexc = 449 nm, slits: 5/5 nm).

Figure 2 Fluorescence intensity of (S)−1 (25 µmol/L in DMSO, 1 equiv.) + L/D-His (in pH 7.4 HEPES buffer, 25 equiv.) at 550 nm versus the equivalent of Zn2+ (λexc = 449 nm, slits: 5/5 nm).

Figure 3 Fluorescence intensity at 550 nm when (S)−1 (25 µmol/L in DMSO, 1 equiv.) + Zn2+ (in H2O, 2 equiv.) reacting with L-/D-His (25 equiv.) dissolved in buffer with different pH values (column charts); ef values versus the pH values (red line) (λexc = 449 nm, slits: 5/5 nm).

Figure 4 (a) Fluorescence spectra of (S)−1 (25 µmol/L in DMSO, 1 equiv.) + Zn2+ (in H2O, 2 equiv.) + L/D-His (in pH 7.4 HEPES buffer, 25 equiv.) at different standing time (0–190 min). (b) Fluorescence intensity at 550 nm versus standing time (λexc = 449 nm, slits: 5/5 nm).

Figure 5 Fluorescence intensity of (S)−1 (25 µmol/L in DMSO, 1 equiv.) + Zn2+ (in H2O, 3 equiv.) at 550 nm versus the equivalent of His (λexc = 449 nm, slits: 5/5 nm, the error bars are from three independent experiments).

Figure 6 Fluorescence intensity of (S)−1 and (R)−1 (25 µmol/L in DMSO, 1 equiv.) + Zn2+ (H2O, 3 equiv.) at 550 nm towards His with different ee values (in pH 7.4 HEPES buffer, 25 equiv.) (λexc = 449 nm, slits: 5/5 nm, the error bars are from three independent experiments).

Figure 7 Enantioselective fluorescence imaging of His in HeLa cells: (a) Incubated with (S)−1 (40 µmol/L in 2% DMSO/pH 7.4 buffer); (b) incubated with (S)−1 (40 µmol/L in 2% DMSO/pH 7.4 buffer) and Zn2+ (40 µmol/L in pH 7.4 buffer); (c) incubated with (S)−1 (40 µmol/L in 2% DMSO/buffer), Zn2+ (40 µmol/L in pH 7.4 buffer) and L-His (1 mmol/L in pH 7.4 buffer); (d) incubated with (S)−1 (40 µmol/L in 2% DMSO/buffer), Zn2+ (40 µmol/L in pH 7.4 buffer) and D-His (1 mmol/L in pH 7.4 buffer). Scale bar: 100 µm. (e) The IOD of green fluorescence signal being calculated by ImageJ.

Figure 8 1H NMR spectra of the (S)−1 (in d6-DMSO) (line 1), (S)−1 (in d6-DMSO, 1 equiv.) + Zn2+ (in D2O, 3 equiv) (line 2), (S)−1 (in d6-DMSO, 1 equiv.) + Zn2+ (in D2O, 3 equiv.) + L-His (in pH 7.4 HEPES buffer prepared by D2O, 25 equiv.) (line 3), (S)−1 (in d6-DMSO, 1 equiv) + Zn2+ (D2O, 3 equiv.) + D-His (in pH 7.4 HEPES buffer prepared by D2O, 25 equiv.) (line 4).

Figure 9 Deduced modeling structures and thermodynamic stability of the products from mixtures of (S)−1 with (a) D-His and (b) L-His in the presence of Zn2+. The results are based on DFT calculations by Gaussian 16 program, the computational details were shown in Supporting information.
Table 1. Determination of the ee values of His samples by using the fluorescent probes (S)−1 and (R)−1.
|
|
 下载: 导出CSV

 扫一扫看文章

扫一扫关注我们

 下载:
下载: