Evolution of template-assisted two-dimensional porphyrin chiral grating structure by directed self-assembly using chiral second harmonic generation microscopy
Citation:
Changhui Yu, Peng Shang, Huihui Hu, Yuening Zhang, Xujin Qin, Linyu Han, Caihe Liu, Xiaohan Liu, Minghua Liu, Yuan Guo, Zhen Zhang. Evolution of template-assisted two-dimensional porphyrin chiral grating structure by directed self-assembly using chiral second harmonic generation microscopy[J]. Chinese Chemical Letters,
2024, 35(10): 109805.
doi:
10.1016/j.cclet.2024.109805
Evolution of template-assisted two-dimensional porphyrin chiral grating structure by directed self-assembly using chiral second harmonic generation microscopy
English
Evolution of template-assisted two-dimensional porphyrin chiral grating structure by directed self-assembly using chiral second harmonic generation microscopy
Beijing National Laboratory for Molecular Sciences, State Key Laboratory of Molecular Reaction Dynamics, Institute of Chemistry, Chinese Academy of Sciences, Beijing 100190, China
b.
University of Chinese Academy of Sciences, Beijing 100049, China
c.
Beijing National Laboratory for Molecular Science, CAS Key Laboratory of Colloid, Interface and Chemical Thermodynamics, Institute of Chemistry, Chinese Academy of Sciences, Beijing 100190, China
Received Date:
24 February 2024 Accepted Date:
20 March 2024 Revised Date:
20 March 2024 Available Online:
15 October 2024
Abstract:
Directed self-assembly has been used to create micro-nano scale patterns, including chiral periodic structures of organic molecules, for potential applications in optics, photonics, metamaterials, and medical and sensing technologies. This study presents a straightforward approach for fabricating large-scale chiral grating porphyrin assemblies through template-assisted techniques. The solution of tetrakis(4-sulfonatophenyl)porphyrin (TPPS) was induced by chiral amino acids (L/D-arginine and L/D-serine) to self-assemble into highly ordered chiral grating structures with the assistance of sodium dodecyl sulfate (SDS). The structures show precise line widths (5.5 µm) and gaps (18 µm). Using in situ optical microscopy and second harmonic generation (SHG) microscopy, the chiral characteristics and dynamic evolution of the template-assisted self-assembly are investigated. It is found that the chirality of amino acids induced TPPS self-assembled into chiral structures and the liquid contraction interface significantly enhanced the chirality of the assemblies. This study is significant for understanding the mechanism of chiral evolution and designing novel micro-nano materials with predetermined chiral properties.
Employing template-assisted self-assembly produces highly uniform and structured periodic micro-nano structures so that they are attractive for nanofabrication [1–3]. In comparison to conventional techniques such as photolithography, electron beam etching, or atomic layer deposition, template-assisted is relatively economical and capable of large-scale production. Utilizing intermolecular interactions, this bottom-up self-assembly approach provides precise control and design of micro-nano structures [4]. Despite the drawbacks of the method being strongly dependent on template and molecular properties and the limitations of the assembled structure in terms of environmental stability and conductivity. However, due to its advantages of convenience, speed and economy, research in this field still attracts wide interest. Chirality is extensively observed in both natural and artificial structures, spanning multiple levels from molecular to supramolecular and even large-scale structures [5]. In materials science, it is important to precisely understand and design building units for the realization of enantioselective synthesis, ranging from chiral molecules and chiral supramolecular to chiral materials [6–8]. Chiral materials at the micro-nano scale find wide applications in fields such as chips, information storage, sensing, and micro-optical devices [9–11]. Therefore, the precise control and design of micro-nano structures using a bottom-up self-assembly approach is attracting significant interests [12]. Porphyrin, an aromatic molecule with four pyrrole rings, possesses a unique planar structure and a π-conjugated system. This property enables them to form strong π-π interactions and make porphyrins ideal candidates for constructing functional assemblies [13,14]. In the field of biology, porphyrin molecules are utilized to construct nanomaterials with fluorescent properties and biological activity, which offer new opportunities for bioimaging and therapeutic applications [15–17]. Additionally, porphyrin assemblies have demonstrated potential application prospects in areas including optoelectronic devices and catalysis [18–21]. Previous studies have demonstrated that the addition of chiral inducers or additives such as amino acid molecules can induce achiral porphyrins to form chiral assemblies, and chirality transfer from chiral molecules to supramolecular assemblies, which is known as the "sergeant-soldier" principle [22,23]. When pH < 4, the sulfonic acid group and center of tetrakis(4-sulfonatophenyl) porphyrin (TPPS) will be protonated to form H4TPPS2−, which will spontaneously form J-aggregates. In the acidic solution, there will be electrostatic interaction between amino acids and TPPS, which make the chiral transfer from the chiral amino acid to TPPS J-aggregates [23]. The chiral assembly of porphyrins is widely applied in fields such as chiral sensing and recognition, asymmetric catalysis, circularly polarized luminescence, and spintronic devices [24–27].
The morphology and chiral characterization of micro-nano scale chiral structures remains a challenge in chirality studies. This is primarily due to the reliance on traditional circular dichroism (CD) spectroscopy, which is based on the differential absorption of left and right circularly polarized light. As a result, the signal of CD, ORD and ROA has to take into account the very weak interaction between the electric and magnetic dipole transition moments within a molecule that such difference is usually on the order of one part of 1000 of the average absorbance of the sample [28]. Therefore, although CD-based imaging has also been reported [29], in situ detection of the spatial distribution dynamics of chiral self-assembly has still not been reported yet. Due to the inherent lack of a symmetry center in chiral molecules and their structures, they exhibit a strong second harmonic generation (SHG) response [30,31]. For second harmonic generation linear dichroism (SHG-LD) or SHG circular dichroism (SHG-CD), only the dipole moment will take into account, such difference in the surface SHG measurement with the left and right circular polarized lights can be on the order of 100% or several times less of the average SHG signal of the chiral surface [32]. Consequently, techniques such as SHG-LD and SHG-CD spectroscopy are widely used for characterizing chiral collagens and materials [33–35]. Taking SHG-LD as an example, the chirality measured by this method can be quantitatively analyzed in terms of the magnitude and direction of the degree of chiral excess (DCE) [36,37]. By calculating the DCE, the magnitude and direction of chirality in molecular assemblies at interfaces can be determined. To date, the primary microscopy techniques for characterizing the morphology of chiral structures are wide-field CD imaging [38], confocal CD imaging [39], and SHG imaging [40,41]. The first two imaging methods are primarily based on linear CD spectroscopy imaging and lack molecular specificity. In contrast, SHG imaging is sensitive to chiral structures and free from photodamage and photobleaching, making it an effective tool for studying chiral structure imaging. Moreover, it can provide structural information specific to certain molecules [42–44]. According to the rigid TPPS molecular structure and TPPS normally formed J-aggregates at pH < 4, it is normally formed asymmetric chiral packing layer structure as shown in previous literatures without clear chiral feathers like chiral morphology, pitch length, diameter of helices which can be characterized by AFM, TEM and SEM [2,45–48].
This study presents for the first time the large-scale, highly ordered chiral grating assembly of TPPS molecules induced by chiral amino acids on glass substrates using the template-assisted method as shown in Fig. 1. The magnitude and morphology of the chirality of these assemblies were characterized using SHG chiral imaging techniques. Studies using bright-field optical microscopy and SHG-LD imaging (SHG microscopy set-up and Fig. S1 in Supporting information) on the time evolution of the assembly revealed that the self-assembly process includes rapid solution flow to the confinement structure and a slow solution contraction, ultimately leading to the formation of chiral micro-nano structures through TPPS self-assembly. We focus on the transfer kinetics of molecular chirality to micro-nano structured chirality, and the assembly of TPPS molecules with photoelectric functions into periodic structures with chirality in a confined environment. By thoroughly investigating the dynamics of chiral assembly, this study provides a molecular mechanism for obtaining large-scale TPPS chiral micro-nano structures through template-assisting. This study offers new methods and characterization techniques for future assembly control and design of large-scale structures with specific micro-nano chirality and functionality.
Figure 1
Figure 1.
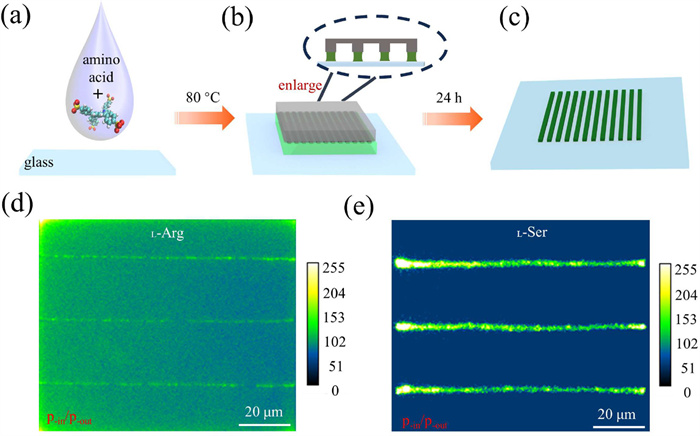
(a-c) Schematic diagram of the assembly process of micro-nano structures. Second harmonic images of (d) L-Arg and (e) L-Ser induced TPPS with p-in/p-out polarization combinations. The exposure time was 40 s, the average laser power was 50 mW, and the magnification was 40×.
The assembly process of the chiral micro-nano structures in this study is depicted in Figs. 1a-c. The mixed solution, dropped onto a glass substrate, consists of 3.5 wt% TPPS (≥95% Sigma-Aldrich) and chiral amino acid molecules l-arginine (L-Arg), d-Arg, l-serine (L-Ser), or d-Ser from Sigma-Aldrich (99%). The molar ratio of amino acids to TPPS is 1:5. Additionally, HCl is used to adjust the pH < 2, and 0.4 wt% sodium dodecyl sulfate (SDS, J&K, 99%) is employed to stabilize the air/liquid interface and mentioned in previous report [47]. Previous research has demonstrated that the order in which solutions are mixed affects the chirality of tartaric acid induced porphyrin J-aggregates [49]. Therefore, in this study, amino acids and HCl were pre-mixed, followed by the addition of TPPS, and finally, the surfactant SDS was added. Glass substrate and silicon templates (fabricated by the School of Microelectronics at Peking University, 1 cm × 10 µm × 10 µm, with silicon pillar spacing of 12.5 µm) were cleaned with piranha solution (H2SO4: H2O2 = 7:3), then washed with water and ethanol, and dried with nitrogen gas. Subsequently, 4 µL sample of the mixture was placed on the glass substrate, and then the silicon template was covered over it. Due to capillary forces creating a curved air/liquid interface, the addition of SDS stabilized the two air/liquid interfaces between the glass substrate and the silicon template (Fig. 1b). After 24 h of assembly, the silicon template was removed. As shown in Fig. 1c, the grating-type TPPS chiral micro-nano structures were assembled on the glass substrate. During the preparation process, assemblies were conducted at room temperature, 50 ℃, 80 ℃, and 100 ℃ (Fig. S2 in Supporting information). It was found that the assembly at 80 ℃ resulted in more uniform lines, enabling the creation of large-scale chiral assembly structures. Figs. 1d and e show the SHG imaging of grating-type TPPS self-assembled structures under a polarization combination of p-in/p-out induced by L-Arg and L-Ser, respectively. The SHG images reveal that the assembled TPPS molecules exhibit strong SHG signals, with the grating structures having an approximate gap of 18 µm and a line width of about 5.5 µm. The SHG images reveal that large-scale (approximately 1 cm × 1 cm) and highly SHG-active ordered microstructures were successfully fabricated using the template-assisted method.
Previous studies have confirmed the effective induction of achiral TPPS molecule assembly into supramolecular chiral structures by chiral molecules [14]. Consequently, we employed SHG microscopy to quantify the chirality of supramolecular chiral structures formed by the assembly. Based on SHG theory (SHG-LD theory section in Supporting information), we measured the polarization combinations of +45°-in/S-out and −45°-in/S-out, as shown in Fig. 2. By applying Eq. 1, as shown below:
(1)
Figure 2
Figure 2.
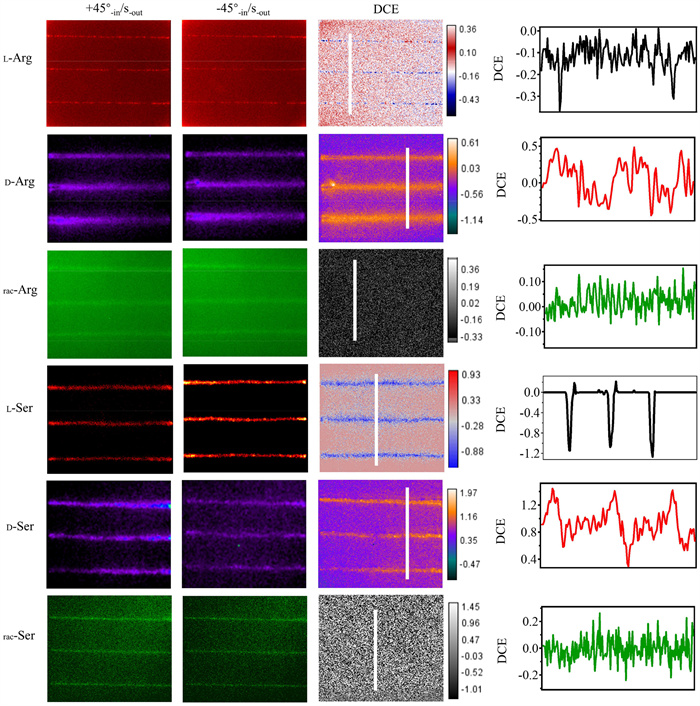
SHG imaging (+45°-in/S-out and −45°-in/S-out polarization combination) of micro-nano structures incorporating different amino acids and calculated DCE mapping. The DCE value on the white cut line in DCE mapping is represented by the right column. It clearly shows that serine induced chiral assembly structure of TPPS exhibits greater order than arginine. The exposure time was 40 s, the average laser power was 50 mW, and the magnification was 40×.
here, I(2ω) denotes the SHG intensity at the corresponding polarization (subscript), allowing for the calculation of DCE values in the supramolecular chiral assembly structures. Here we directly measure +45°-in/S-out and −45°-in/S-out that we can get the mapping for DCE value. Initially, based on Fig. 2, it is evident that both l/d Arg and L/D-Ser chiral amino acids induce TPPS to form supramolecular assemblies with opposite signs of DCE. This finding aligns with the "sergeant-soldier" principle, where the chirality of the assemblies originates from the chiral amino acids. Moreover, the addition of racemic amino acids results in assemblies lacking supramolecular chirality. In SHG-LD imaging, the signal is mainly derived from TPPS, and the detected chiral signal is derived from the chiral assembly of TPPS, so chirality goes from chiral amino acid molecules to TPPS aggregates and finally to micro-nano structures. Based on MD simulations in the previous literature, the resulting porphyrins may form hierarchical structure [2,47]. Additionally, the DCE images reveal that the assemblies induced by Arg exhibit a smaller absolute value of chirality (~0.2), while those induced by Ser can reach up to 1.2. The different hydrophobic structures and charges of selected chiral amino acids in this study impact the induced chirality of the porphyrin J-aggregates. Our findings regarding the relative magnitude of chirality are consistent with the literature [23]. Finally, in comparison to l-type amino acids, assembly lines induced by d-type amino acids are thicker. This difference is likely due to the subtle structural variations between L/D-amino acids. In previous literature, Wu and colleagues observed that in the self-assembly of porphyrin derivatives (TCPP) induced by lysine, the morphologies induced by l-type and d-type lysine were different [22].
Fig. 2 reveals that the chiral assembly induced by L-Ser shows greater chirality and stronger SHG signals, suggesting that the assembly structures of TPPS under the induction of L-Ser are more ordered. Therefore, in the following section focusing on assembly evolution dynamics, we will use L-Ser induced TPPS as an example. To gain insight into the formation and evolution dynamics of the chirality of micro-nano structures, we initially observed their formation process using bright-field optical microscopy, as shown in Fig. 3. Due to the lack of molecular specificity in bright-field optical microscopy, we could only monitor the dynamic evolution of the solution distribution. Figs. 3a-h illustrate the time-lapse bright field imaging of TPPS assembly with chiral amino acids on the silicon template. In the real-time monitoring of assembly kinetics, we preheated the mixed solution to 80 ℃, and due to the spatial constraints in the microscope imaging setup, the assembly was completed at room temperature. Observation from the initial stage of assembly (0 s) to the near completion (120 min) visually describes the assembly kinetics of amino acid-induced TPPS assembly into grating-type micro-nano structures.
Figure 3
Figure 3.
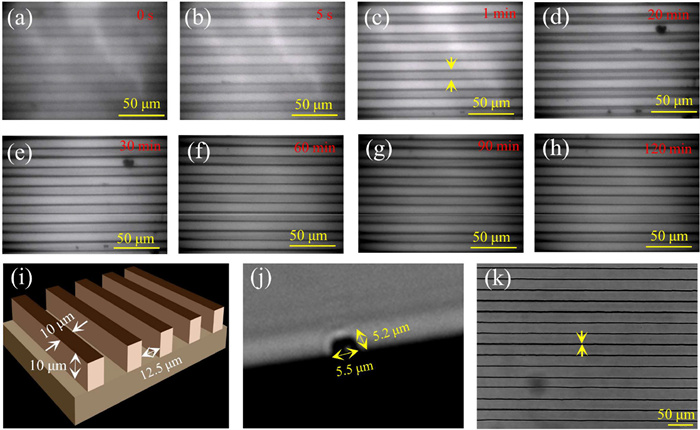
(a-h) Bright-field imaging as a function of time. L-Ser was added to the mixed solution. (i) 3D schematic of the silicon template and size information. Sectional view (j) and large-area bright-field (k) images of the assembly after removal of the silicon template. (j) shows the dimensions of the width and height of the assembly. The solution is initially confined to the area denoted by the arrow in (c), and finally, the template is removed and assembled into the position indicated by the arrow in (k).
The initial state (Fig. 3a) shows the Ser/TPPS/SDS aqueous solution evenly distributed between the template and the glass substrate, with the solution flowing between the glass substrate and the silicon template. Within 5 s (Fig. 3b), the contrast between light and dark becomes clearer, indicating that the solution begins to be confined to the raised areas of the glass substrate and silicon template. At 1 min, the solution is mostly confined to these raised areas. The stripes in this confined environment become clearer and more evenly spaced (Fig. 3c). Afterwards, the edges of the raised parts of the silicon template thicken, which is due to the solution gathering at the curved liquid surface because of the "coffee ring" effect [50]. At 30 min (Fig. 3d), as the solution evaporates, the lines become very fine. From 30–120 min (Figs. 3e-g), the assembly reaches a stable state, with no significant changes observed in the distribution of the solution. Fig. 3i presents a 3D image and provides size information of the silicon template, while Fig. 3j shows a cross-sectional view of the assembly. Despite no significant differences observed in the bright field after 30 min, the final line width (5.5 µm) is much smaller than the template width when compared to the size of the silicon template. The gap (~18 µm) is also much larger than the gap of the silicon pillars (12.5 µm), suggesting a slow solution contraction process. This occurs because liquid evaporates more rapidly at the edges, creating an outward capillary flow from the liquid interior towards the edges. This transports solution molecules to the edge under the influence of the capillary flow. Subsequently, due to the "coffee ring" effect, the solution accumulates at the curved liquid surface. When a droplet evaporates in a confined space, the physical structure can control the evaporation dynamics of the droplet, resulting in regular and orderly patterns [51].
Additionally, in the case of suboptimal aggregation processes as shown in Fig. S3 (Supporting information), wider lines are observed upon removal of the silicon substrate after assembly completion compared to those formed under optimal conditions. The presence of lines with varying widths and thicker edges indicates the occurrence of liquid contraction during the assembly process (Fig. S3). The above discussion confirms that TPPS aggregation primarily occurs at the interface of the curved liquid surface. The final image after the silicon template was removed (Fig. 3k) displays a highly ordered structure, demonstrating that the template-assisted method achieved regular and orderly assembly. This progress involves both rapid solution flow confinement (within 1 min) and a slow solution contraction.
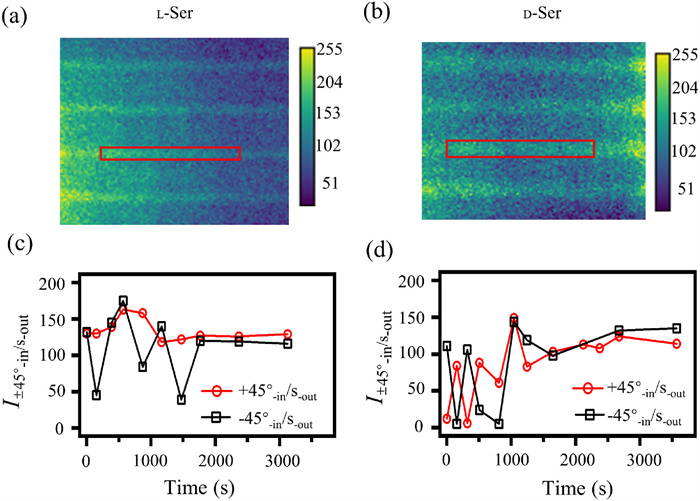
As we discussed, the chiral molecules induced TPPS aggregates to form a supramolecular chiral structure, so it is necessary to study the process of chiral self-assembly. To study the chiral evolution process from chiral amino acids to higher-level chiral micro-nano structures, we investigated the assembly process of TPPS chiral structure induced by L-Ser and d-Ser using chiral SHG imaging. To maintain a favourable signal-to-noise ratio, we selected the red rectangular areas in Figs. 4a and b to calculate the average gray values. The temporal changes in chiral SHG under +45°-in/S-out and −45°-in/S-out polarization combinations are shown in Figs. 4c and d. Given that TPPS has not yet formed an ordered structure in the initial assembly stages, the SHG signal intensity is relatively weak. It is evident that there is almost no chirality at the beginning of the assembly (+45°-in/S-out = −45°-in/S-out), but around 30 min, L-Ser and d-Ser induce opposite chirality in the supramolecular assembly. For L-Ser (+45°-in/S-out > −45°-in/S-out), and d-Ser (+45°-in/S-out < −45°-in/S-out).
Figure 4
Figure 4.
SHG intensity under +45°-in/S-out and −45°-in/S-out polarization combinations as a function of time. (a, c) L-Ser and (b, d) d-Ser are added to the solution. The gray values in (c, d) are the average shown in the red rectangular of (a, b). (a) and (b) are the SHG imaging during the assembly process, used to illustrate the regions for the calculated average gray values shown in (c) and (d).
Although the bright-field imaging Figs. 3e-h reveal minimal change in the solution image within 30–120 min, observations from this imaging indicate solution contraction due to evaporation during this period. By comparing Figs. 4c and d, it becomes evident that the opposite chirality induced by L-Ser and d-Ser initiates around 30 min. Therefore, we infer that liquid contraction enhances the chiral assembly of TPPS molecules, leading to an increase in the chirality of the TPPS assembly structure over time. According to our previous report, the process also has hierarchical chirality [46], and the confined process in this paper contributes more to the chiral structure. In summary, the chirality of amino acids is transferred to the porphyrin J-aggregates, and then the liquid contraction promotes an increase in the chirality of TPPS assembly. Furthermore, as the sample is assembled on a glass substrate, its anisotropy results in variations in the intensities of +45°-in/S-out and −45°-in/S-out [52]. Consequently, we fixed the detection polarization to p and rotated the incident polarization. The results are shown in Fig. S4 (Supporting information). It can be observed that the assembly does not exhibit significant anisotropy, indicating that the DCE values reflect the structural chirality magnitude of the TPPS supramolecular assemblies.
This study successfully achieved the assembly of large-area chiral micro-nano structures using template-assisted methods and characterized the chiral properties of the assembly through chiral SHG microscopy imaging. Experimental results revealed the evolution of chirality during the assembly process and confirmed the key role of amino acids as chiral seeds in the formation of chirality in the assembly. In addition, the liquid evaporation and solution shrinkage significantly enhance the chirality of the supramolecular assembly. These findings provide an important perspective for understanding the evolution of chirality during supramolecular assembly. It is noteworthy that the strategy presented here focuses on grating-type micro-nano structure assembly. It is noteworthy that the strategy presented here only focuses on the assembly of grating-type micro-nano structures. Due to the excellent optical properties of porphyrin molecules, the photoelectric properties of porphyrin gratings can be further regulated by adjusting the distance between the grating template and the thickness of fringes. Alternatively, we can change the template to design structures with different functions. Considering the application, we have done a finite difference time domain (FDTD) simulation, which can see a weak decrease in the absorption at 1300 cm−1. By changing the gap can change the absorption intensity (Fig. S5 in Supporting information). The morphology of the template determines macroscopic assembly structure. We use the most common grating template for research purposes aiming to provide a model mechanism study and propose a feasible scheme for future applications. We anticipate that this method will be equally applicable to other structures as well. The application of this technology offers an important approach towards achieving bottom-up assembly of micro-nano devices. In future semiconductor or optical material research, further parameter optimization is required for synthesizing molecules with better photoelectric functions and fabricating large-scale self-assembled periodic structures with uniform distribution using template-assisted methods. These aspects will be explored further in our future studies.
Declaration of competing interest
The authors declare that they have no known competing financial interests or personal relationships that could have appeared to influence the work reported in this paper.
We thank Z. Y. Qu and Prof. Y. L. Qiao. for their thoughtful discussion and suggestions in the templet-assisted TPPS assembly. Z. Zhang is grateful for funding from the National Natural Science Foundation of China (NSFC, Nos. 22173112 and 91856121), and Chinese Academy of Sciences for support (No. YJKYYQ20180014).
Supplementary materials
Supplementary material associated with this article can be found, in the online version, at doi:10.1016/j.cclet.2024.109805.
K.X. Li, T.L. Zhang, H.Z. Li, et al., Acta Phys. Chim. Sin. 36 (2020) 1911057.
[52]
D.C. Hooper, A.G. Mark, C. Kuppe, et al., Adv. Mater. 29 (2017) 1605110. doi: 10.1002/adma.201605110
Figure 1
(a-c) Schematic diagram of the assembly process of micro-nano structures. Second harmonic images of (d) L-Arg and (e) L-Ser induced TPPS with p-in/p-out polarization combinations. The exposure time was 40 s, the average laser power was 50 mW, and the magnification was 40×.
Figure 2
SHG imaging (+45°-in/S-out and −45°-in/S-out polarization combination) of micro-nano structures incorporating different amino acids and calculated DCE mapping. The DCE value on the white cut line in DCE mapping is represented by the right column. It clearly shows that serine induced chiral assembly structure of TPPS exhibits greater order than arginine. The exposure time was 40 s, the average laser power was 50 mW, and the magnification was 40×.
Figure 3
(a-h) Bright-field imaging as a function of time. L-Ser was added to the mixed solution. (i) 3D schematic of the silicon template and size information. Sectional view (j) and large-area bright-field (k) images of the assembly after removal of the silicon template. (j) shows the dimensions of the width and height of the assembly. The solution is initially confined to the area denoted by the arrow in (c), and finally, the template is removed and assembled into the position indicated by the arrow in (k).
Figure 4
SHG intensity under +45°-in/S-out and −45°-in/S-out polarization combinations as a function of time. (a, c) L-Ser and (b, d) d-Ser are added to the solution. The gray values in (c, d) are the average shown in the red rectangular of (a, b). (a) and (b) are the SHG imaging during the assembly process, used to illustrate the regions for the calculated average gray values shown in (c) and (d).

 DownLoad:

 下载:
下载:


 下载:
下载:
