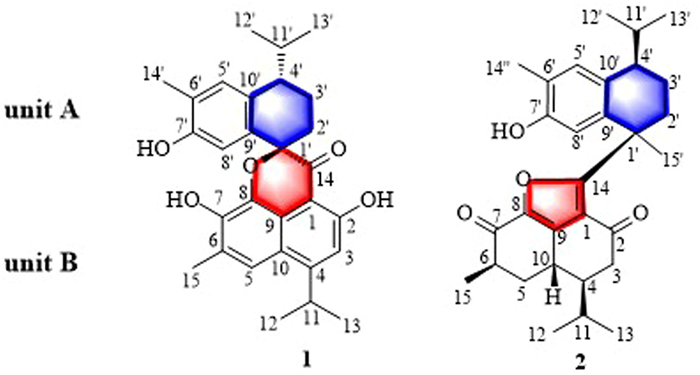
Figure 1.
Structures of 1 and 2.
Plant-microbial interactions inspired the discovery of novel sesquiterpenoid dimeric skeletons of hidden natural products from Hibiscus tiliaceus
Deli Chen , Jiawen Li , Xudong Xu , Zhaocui Sun , Yun Yang , Minghui Xu , Hanqiao Liang , Junshan Yang , Hui Meng , Guoxu Ma , Jianhe Wei

Historically, natural products (NPs) commonly termed "secondary metabolites", are characterized by enormous scaffold diversity and structural complexity, and they represent a major chemical resource. These compounds have played a crucial role over the last 200 years in treating and preventing diseases [1,2]. According to statistics presented by Newman et al., from 1981 to 2019, approximately half of newly approved drugs are naturally occurring or are structural analogues of naturally occurring compounds [3].
However, with increased longevity coupled with the rampant rise in antibiotic resistant bacteria and infectious diseases, there is a dire need for new therapeutic agents. Moreover, NPs with novel carbon skeleton discovery were associated with some intrinsic difficulties according to the conventional approach of rigorous screening of crude extracts from natural sources, especially from plant materials, due to high rediscovery rates of known natural products [4]. It was thought that the natural product potential of traditional producers had been fully explored from the 1990s onwards [5]. In recent years, several technological and scientific developments, such as genome mining, engineering strategies, improved analytical tools, and microbial culturing advances, have addressed such challenges and opened up new opportunities, bringing secondary metabolite producers back into the research spotlight because genetic data have shown that the metabolic capabilities of these 'tapped' natural resources are severely underestimated [6–8]. Nevertheless, these methods have been used successfully in the discovery of NPs of microorganisms, including fungi, bacteria, actinomycetes, and algae, and their application to higher plants still presents challenges and technical barriers [9–12].
Recently, studies of plant microbial interactions stimulating the plant immune system have provided insight into mining novel NPs [13–15]. Plants in their natural environment are constantly attacked by large numbers of microbial pathogens, which lead to the evolution of a sophisticated immune system for responses that initiate pathogen-associated molecular patterns (PAMPs) [16]. The immune response systems activate defense related gene expression and various downstream signal transduction pathways and ultimately lead to the biosynthesis of direct defensive or specialized metabolites (hidden natural products (HNPs)) against pathogen attacks [17]. However, these HNPs are absent in healthy plants and are induced by various adverse stresses, as one representative defensive strategy exhibits direct antagonistic effects against attacks by pathogens and is known to play a central role in the defence response serving as the "chemical" language for plant-microorganism defensive weapons [18]. Thus, it is of important scientific value and social economic benefit to unearth HNPs from higher plants as potential agents for chemists to develop of new drugs. In this paper, we highlight strategies for plant-microbial interactions inspired by the discovery of novel HNPs through isolation with ultra-performance liquid chromatography-quadrupole-time of flight mass spectrometry (UPLC-QTOF-MS) as a guiding technique that has helped discover neglected or unpopular organisms as capable secondary metabolite producers, particularly in diseased states when their immune systems are activated.
The Malvaceae plant Hibiscus tiliaceus L. is widely distributed in tropical and subtropical coastal ecosystems, such as southeastern Asia, the Pacific Islands, the South Sea Islands, India, southern Brazil and southern China [19]. According to our previous investigations, the infected stems of H. tiliaceus produce a large number of novel HNPs, including the cadinane sesquiterpenes monomer, which differs from naturally occurring products isolated from healthy H. tiliaceus trees [20,21].
Moreover, third-generation transcriptome sequencing technology was used to construct a comprehensive full-length transcriptome library for the first time and identified 109 delta-cadinene synthase genes (HtCDNs) and modifying enzyme-encoding genes (HtADH, HtODD, and HtCYPs) that were upregulated and expressed during infection. UPLC-QTOF-MS guided fractionation led to the isolation of two unusual cadinane-type sesquiterpenoid-derived heterodimers, hibisceusanols A (1) and B (2) from pathological tissue (Fig. 1). Compound 1 showed a unique nor-cadinane-heterodimer backbone at C-1′ with an unusual 1-oxaspiro[6.6]decane ring and a new manner of bond connection (C-1 and C-14, C-9 and oxygen on C-1′). Compound 2 represents an unusual cadinane-dimer carbon skeleton incorporating a fused-furan tricyclic with a dicyclic cadinane sesquiterpene dimer from C-14 to C-1′. Each of these compounds was composed of a novel and undescribed carbon skeleton and showed significant antitumor activity. The preliminary mechanistic study implied that compound 2 induced apoptosis and arrested the cell cycle of HepG2 cells in the G2/M phase in a dose-dependent manner by inhibiting the phosphatidylinositol 3-kinase (PI3K) pathway.
This example provided a new strategy to discover HNPs as drug candidates induced by plant-microbial interaction stimulation of the plant immune system response to PAMPs through the interaction between plants and microorganisms.
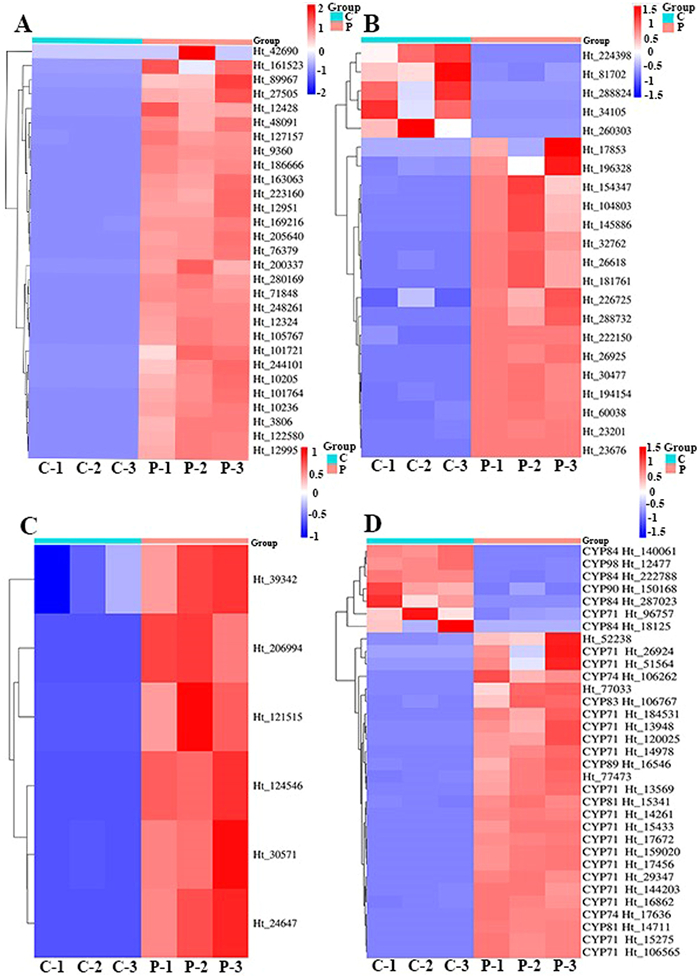
In this study, the full-length transcripts of H. tiliaceus were used as a reference to identify the differentially expressed genes (DEGs) in the stems of uninfected and pathogen-infected plants (Fig. SB2 in Supporting information). Based on the NCBI database, the amino acid sequences of cadinane-type sesquiterpenoid pathway genes with significant differences in expression were analysed, and a higher homology was observed between the HtCDN of H. tiliaceus and Gossypium arboreum (Table SB1 in Supporting information). Additionally, HtCDN and HtODD were significantly upregulated in the pathogen-infected group (Fig. 2). A few HtADH and HtCYP genes, which act as modifiers, were highly expressed in the untreated control group, and may have played roles in other biosynthetic pathways. This trend in expression was consistent with the database results (Fig. 2).
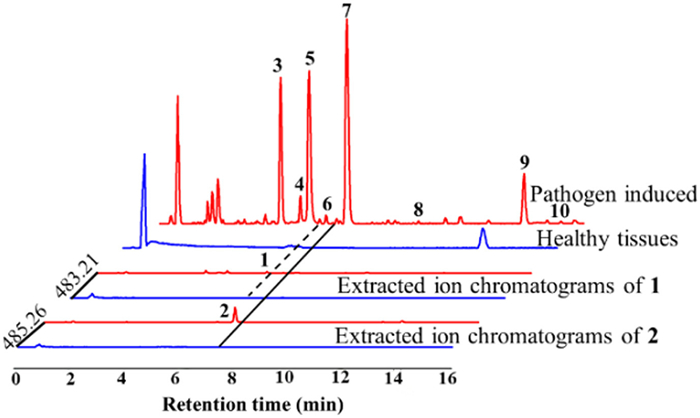
Furthermore, samples of healthy stems and infected stems of H. tiliaceus were harvested and subjected to detailed analysis by UPLC-QTOF-MS in positive mode for screening, which revealed that base peak ion chromatography showed significant differences between infected and healthy stem tissues (Fig. 3). Major chromatographic components in pathogen-induced stems showed molecular ion peaks at m/z 200–300, corresponding to a molecular formula with C15, indicating that they might be sesquiterpenoid derivatives. Subsequently, 9 known cadinane-type sesquiterpenoids (Fig. SC17 in Supporting information) were obtained and identified using NMR and MS spectra data with the reported literature, and labelled on the peaks are shown in Fig. 3. These structures exhibited flexible fused-furan tricyclic and dicyclic cadinane sesquiterpene frameworks with similar intermediate products of the gossypol biosynthetic pathway, combined with abundant molecular ion peaks at m/z 400–600 in the total ion chromatogram (Fig. SC44 in Supporting information), which indicated that they were potentially novel carbon skeletons of cadinane sesquiterpenoid dimers similar to gossypol and are likely to be biosynthesized in infected stems. Thus, they were selected as the targets of interest to be subjected to further phytochemical isolation. Interestingly, two unprecedented carbon skeletons of heterodimers (1 and 2) were isolated from the infected stems of H. tiliaceus and elucidated as follows. Moreover, the extracted molecular ion peaks at m/z 483.2149 [M + Na]+ and 485.2662 [M + Na]+ were present in the infected group but not in the healthy group (Fig. 3). Comprehensive analysis confirmed that compounds 1 and 2 were produced in H. tiliaceus by plant-pathogen interactions.
Hibisceusanol A (1) was obtained as a white powder with an elemental formula of C29H32O5 based on its high resolution electrospray ionization mass spectroscopy (HRESIMS) ion peak at m/z 483.2148 [M + Na]+ (calcd. for C29H32O5Na, 483.2147), accounting for fourteen degrees of unsaturation. Infrared (IR) absorption bands at νmax 3391, 2959, 2869, 1748, 1680 1627, 1540, 1520, 1474, and 1386 cm−1 suggested the presence of hydroxyl, methyl, conjugated carbonyl groups, and benzene rings, respectively. Analysis of the 1H NMR spectrum of 1 (Table SC1 in Supporting information) revealed the presence of four aromatic protons [H-3 (δH 6.94, 1H, s), H-5 (δH 7.47, 1H, s), H-5′ (δH 7.08, 1H, s), and H-8′ (δH 6.80, 1H, s)]; two methylene protons at δH 2.05 (1H, m, H-2′α), 2.25 (1H, m, H-2′β), and δH 1.85 (1H, m, H-3′α), 1.90 (1H, m, H-3′β); three methine groups at δH 3.68 (1H, m, H-11), 2.60 (1H, m, H-4′), and 2.16 (1H, m, H-11′); and six methyl groups [H-12/13 (6H, δH 1.39, dd, J = 1.8, 7.2 Hz), H-15 (3H, δH 2.43, s), H-12′ (3H, δH 0.90, d, J = 6.6 Hz), H-13′ (3H, δH 1.03, d, J = 6.6 Hz), and H-14′ (3H, δH 2.27, s)]. The 13C NMR (Table SC1) and heteronuclear single quantum coherence (HSQC) spectra of 1 revealed signals for 29 carbons, including a carbonyl carbon (δC 199.3), thirteen aromatic quaternary carbons (δC 103.6, 162.5, 158.5, 124.5, 143.5, 132.0, 121.6, 119.5, 83.9, 125.2, 152.3, 134.5, and 133.9), seven methines (δC 112.6, 118.3, 29.6, 43.1, 131.5, 114.8, and 31.1), two methylenes (δC 30.6, and 20.1), and six methyl carbons (δC 23.3, 23.4, 16.8, 19.0, 21.8, and 16.1). The interpretation of the 2D NMR spectral data allowed for the assignment of two fragments, unit A and unit B (Fig. 1), and their connectivity (Fig. 4).
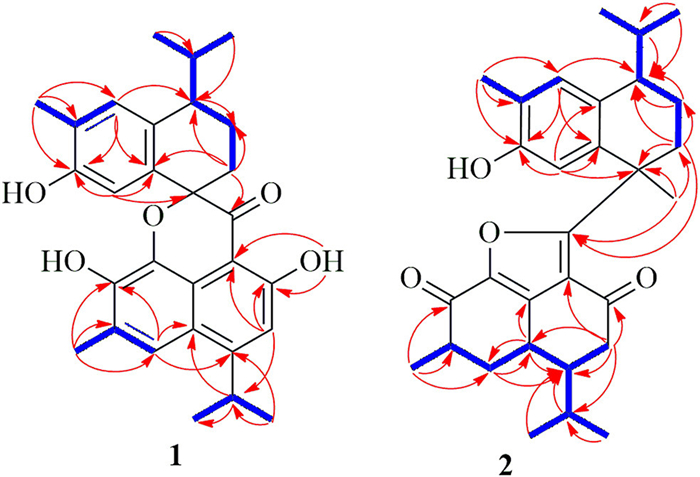
The 1D NMR data of unit A were assigned as a benzocyclohexane nucleus with a hydroxyl group linked to C-7′ because of the heteronuclear multiple bond coherence (HMBC) correlation from H-8′ to δC 152.3 (C-7′) and 134.5 (C-9′). An isopropyl group was located at C-4′ based on the HMBC correlations (Fig. 4) and the correlations between H-2′/H-3′/H-4′/H-11′/H-12′ in the 1H–1H correlation spectroscopy (COSY) spectrum (Fig. 4). It was observed that a methyl group linkage was located at C-6′, and these results were confirmed by the key HMBC correlations from δH 2.27 (H-14′) to C-5′ (δC 131.5), C-6′ (δC 125.2) and C-7′ (δC 152.3) (Fig. 4) and the correlations between H-14′ and H-5′ in the COSY. This analysis and 2D NMR spectroscopy suggested that unit A of 1 was a nor-dicyclic cadinene sesquiterpenoid.
Fragment unit B was elucidated to be a naphthalene nucleus fused-pyrone tricyclic cadinane moiety based on the HMBC and 1H–1H COSY correlations (Fig. 4). The correlations from H-3 to C-1 (δC 103.6), C-2 (δC 162.5), C-11 (δC 29.6) and C-14 (δC 199.3); from H-11 to C-10 (δC 119.5), C-12 (δC 23.3)/C-13 (δC 23.4); from H-12/13 to C-4 (δC 158.5) and C-11; from H-5 to C-4, C-7 (δC 143.5) and C-10; from H-15 to C-5 (δC 118.5), C-6 (δC 124.5), and C-7 (δC 143.5); and from 2-OH (δH 12.2) to C-1, C-2, and C-4 were observed in the HMBC spectrum. In the 1H–1H COSY spectrum, correlations from H-11 to H-12 and H-13 and from H-15 to H-5 were observed. Moreover, the key HMBC correlations from H-2′ to C-14 and from H-5′/H-8′ to C-1′, combined with the chemical shift of the quaternary carbon signal C-1′ at δC 83.9 revealed that fragment unit B was connected to unit A at C-1′ with an unusual 1-oxaspiro[6.6]decane ring and a new manner of bond connection (C-1 and C-14, C-9 and oxygen on C-1′). Finally, the planar structure of 1 was assigned.
Unfortunately, a single crystal of 1 was not obtained despite our efforts. To further confirm the structure of 1, spectroscopic data of 1 were analyzed by computer-assisted structure elucidation (CASE) using the ACD/Structure Elucidator, which can produce all probable isomers corresponding to the given molecular formula and NMR spectra, prevent potential misassignments of cross-peaks and distinguish the correct structure from the deviation values [22,23].
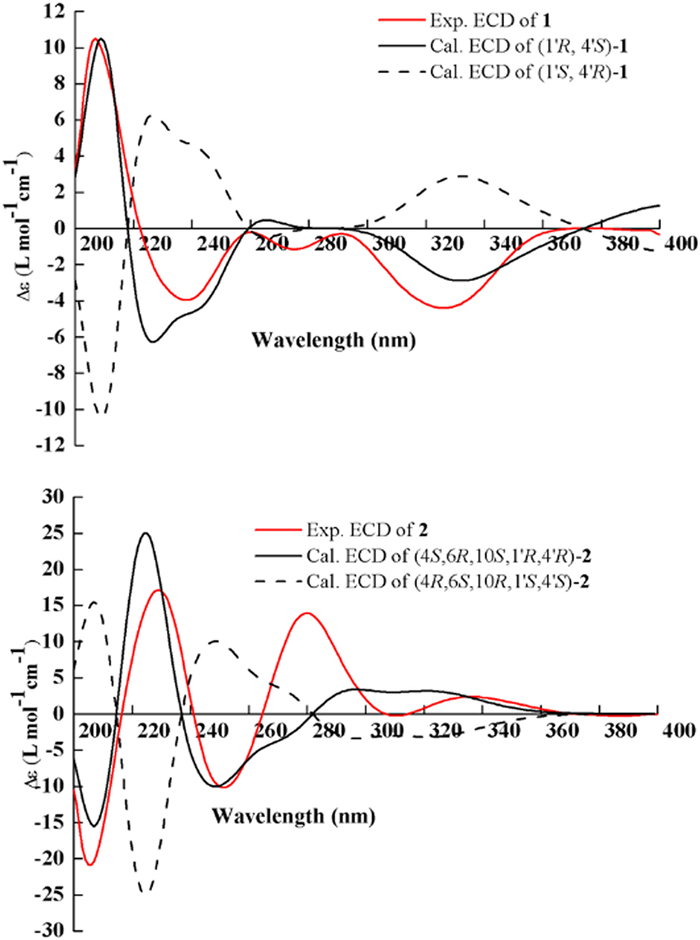
Thus, the molecular formula of 1 and NMR data (including HSQC, nuclear overhauser effect spectroscopy (NOESY), and HMBC) were subjected to ACD/Structure Elucidator, and in 16 min, 25 candidates (Fig. SD3 in Supporting information) were filtered from 875 isomers from the modified molecular connectivity diagram (MCD), as shown in Fig. SD1 (Supporting information). Subsequently, software was used to evaluate all the candidates by calculating 13C chemical shifts with 2 types of methods (HOSE and Neural Network, described as dA and dN, respectively, which are used as the average deviation compared with experimental data). Then structures will be ranked by increasing order of dA (13C) between the experimental and calculated chemical shifts (Table SD1 in Supporting information). Commonly, ACD/SE analysis shows that the correct structure usually has average deviation values of dn < 3 ppm, n = A, N, and ranks it as the first or at least among the top candidates. From Fig. SD3 (Supporting information), the top ten candidates were generated by ACD/Structure Elucidator, and the deduced structure was the first-ranked structure, which was the best-matched structure, showing the highest R2 value (Fig. SD5-A in Supporting information) and the lowest standard deviation values of dA = 1.787 and dN = 1.795. Therefore, the planar structure of 1 was verified and consistent with previous elucidation results, as shown in Fig. 1. The absolute configuration of 1 was determined by a comparison of the calculated and experimental electronic circular dichroism (ECD) spectra using the Gaussian 09 program. The spectra of the experimental and calculated ECD curves were in close agreement (Fig. 5). Thus, the structure of compound 1 was elucidated as shown. Subsequently, the parameter of DP4+ probability was used for the molecules of (1′R, 4′S)−1 (Isomer 1) and (1′R, 4′R)−1 (Isomer 2) based on their NMR shift calculations at the B3LYP/6–311+G(d, p) level [24,25]. The configuration of (1′R, 4′S)−1 was more likely than (1′R, 4′R)−1 (99.82% vs. 0.18%) (Fig. SD6 in Supporting information). Therefore, the absolute structure of 1 was confirmed as 1′R and 4′S. Consequently, the structure of compound 1 was elucidated as shown.
Hibisceusanol B (2) was isolated as a white powder. Its molecular formula was assigned as C30H38O4 based on the 13C NMR spectroscopic data (Table SC1) and the positive HRESIMS ion peak at m/z 485.2661 [M + Na]+ (calcd. 485.2668). Its IR spectrum revealed the presence of hydroxy (νmax3372 cm−1), methyl (νmax2958 cm−1), carbonyl (νmax1670 cm−1), and aromatic benzene ring (νmax 1605, 1607, 1462, 1409, 1387 cm−1). The 1H NMR spectrum (Table SC1) of compound 2 showed signals for two aromatic protons [H-5′ (δH 7.08, 1H, s) and H-8′ (δH 6.12, 1H, s)], four methylene protons [H-3 (δH 2.38, 1H, dd, J = 3.0, 16.8 Hz; 2.17, 1H, m), H-5 (δH 2.15, 1H, m; δH 1.89, 1H, m), H-2′ (δH 2.50, 1H, m; 1.77, 1H, m), and H-3′ (δH 1.82, 1H, m; 1.62, 1H, m)], six methine protons [H-4 (δH 1.82, m), H-6 (δH 2.79, m), H-10 (δH 3.01, m), H-11 (δH 2.00, m), H-4′ (δH 3.04, m), and H-11′ (δH 2.58, m)], and seven methyl signals [H-12 (δH 0.88, d, J = 6.6 Hz), H-13 (δH 0.94, d, J = 7.2 Hz), H-15 (δH 1.37, d, J = 7.8 Hz), H-12′ (δH 1.10, d, J = 7.2 Hz), H-13′ (δH 0.73, d, J = 6.6 Hz), H-14′ (δH 2.17, s), and H-15′ (δH 1.75, s)]. The 13C NMR spectrum showed a total of 30 resonances (Table SC1 in Supporting information), including two carbonyls at δC 192.3 (C-2), and 188.3 (C-7), nine quaternary carbons (δC 16.4, 147.6, 141.6, 174.5, 43.4, 140.9, 151.3, 122.0, and 131.9), eight methines (δC 47.4, 42.7, 30.6, 26.7, 42.0, 128.9, 114.2, and 29.3), four methylenes (δC 40.5, 35.9, 33.7, and 18.3), and seven methyl carbons (δC 15.5, 21.0, 16.7, 21.2, 16.2, 16.0, and 27.5), as confirmed by the HSQC spectrum. Two fragments unit A and unit B and their connectivity were assigned by the 2D NMR spectra (Fig. 4). Analysis of the 1D NMR data obtained for fragment unit A revealed the presence of a characteristic hydroxylated bicyclic cadinane sesquiterpene skeleton. The two six-membered carbon rings were assigned to be benzocyclohexane nuclei with a hydroxyl group linked to C-7′, which was confirmed by the HMBC correlations from δH 6.12 (H-8′) to δC 151.3 (C-7′) and 122.0 (C-9′) and δH 2.17 (H-14′) to C-5′ (δC 128.9), C-6′ (δC 140.9) and C-7′ (Fig. 4). An isopropyl group was located at C-4′ based on the HMBC correlations (Fig. 4) and the correlations between H-2′/H-3′/H-4′/H-11′/H-12′ in the 1H–1H COSY spectrum (Fig. 4). A methyl group linkage was located at C-6′, and these results were confirmed by the key HMBC correlations from H-14′ to C-5′, C-6′, and C-7′ (Fig. 4). This analysis and 2D NMR spectroscopy suggested that unit A of 2 was similar to that of 7–hydroxy-3,4-dihydrocadalin [26].
Fragment unit B was elucidated to be a fused-furan cyclized tricyclic cadinane moiety based on the HMBC correlations and 1H-–1H COSY correlations (Fig. 4) and was highly similar to the known compound hibiscone C [27,28]. The correlations from H-3 to C-1 (δC 116.4), C-2 (δC 192.3), C-4 (δC 47.4), C-10 (δC 30.6), and C-11 (δC 26.7); from H-5 to C-10 and C-4; from H-15 to C-5 (δC 35.9), C-6 (δC 42.7), and C-7 (δC 188.3); and from H-10 to C-5, and C-9 (δC 141.6) were observed in the HMBC spectrum (Fig. 4). In the 1H–1H COSY spectrum, correlations from H-3 to H-4; from H-4 to H-10 and H-11; from H-10 to H-5; and from H-15 to H-5 were observed (Fig. 4). This analysis and 2D NMR spectroscopy confirmed the structure of unit B in 2. In addition, the key HMBC correlation from H-15′ (δH 1.75) to C-14 (δC 174.5); from H-2′ to C-1′ and C-14; and from H-8′ to C-1′, C-9′, and C-7′ revealed that unit A was connected to unit B by a single bond between C-1′ and C-14, forming a unique fused-furan tricyclic cadinane sesquiterpene with a dicyclic cadinane sesquiterpene dimer skeleton.
The C-14/C-1′ single bond between the two units caused a chemical twist that prevented the formation of a suitable single crystal for X-ray analysis, which would have led to a clear assignment of the planar structure. To further determine the overall structure of 2, CASE was performed using the ACD/Structure Elucidator by inputting the molecular formula and NMR data of 2 to generate possible structures, and 21 candidates (Fig. SD4 in Supporting information) were filtered from 603,072 isomers in 30 min from the modified MCD (Fig. SD2 in Supporting information). After ranking the structures and the top ten candidates generated by ACD/Structure Elucidator (Fig. SD4), the first structure showed the best deviation for these two parameters (dA = 2.366, dN = 2.265). Notably, the top hit with the highest R2 value (Fig. SD5-B in Supporting information) between the experimental and calculated chemical shifts (Table SD2 in Supporting information) and lowest standard deviation values by the dN and dA methods was the best-matched structure, which further verified that the above linkages were established, and the planar structure of 2 was determined, as shown in Fig. 1. Subsequently, the absolute configuration of 2 was determined to be 4S, 6R, 10S, 1′R, 4′R, which was further determined by comparing the experimental and calculated ECD spectra (Fig. 5). Thus, the absolute configuration of 2 was unambiguously assigned. On the basis of all this evidence, the chemical structure of 2 was determined, and the structure is shown in Fig. 1.
To evaluate the biological properties of the isolates with such a new chemical scaffold, all of the isolated compounds were evaluated against three tumour cell lines using the MTT method. Paclitaxel served as the positive control and had half maximal inhibitory concentration (IC50) values of 4.3, 2.0 and 2.5 µmol/L against MDA-MB-231, HepG2 and Huh7 cells, respectively. Compound 1 was a potent cell growth inhibitor, and the profiles towards TNBC (anti-MDA-MB-231 with IC50 value of 3.0 µmol/L) and HCC cells (anti-HepG2 and Huh7 with IC50 values of 3.5 and 4.8 µmol/L, respectively). Compound 2 displayed cytotoxic activity against MDA-MB-231, HepG2 and Huh7 cells with IC50 values of 7.2, 2.3, and 4.6 µmol/L, respectively.
To confirm the apoptosis induction of compound 2, propidium iodide (PI)/annexin V double staining was applied. The data obtained with increasing doses of compound 2 (2.5–10 µmol/L) were compared with the control group (0 µmol/L), and compound 2 increased the percentage of apoptotic cells in a dose dependent manner from 12.2% to 40.8% in HepG2 cells (Fig. 6A and Fig. SE1 in Supporting information). These results revealed that compound 2 increased the proportion of both early and advanced HepG2 apoptotic cells.
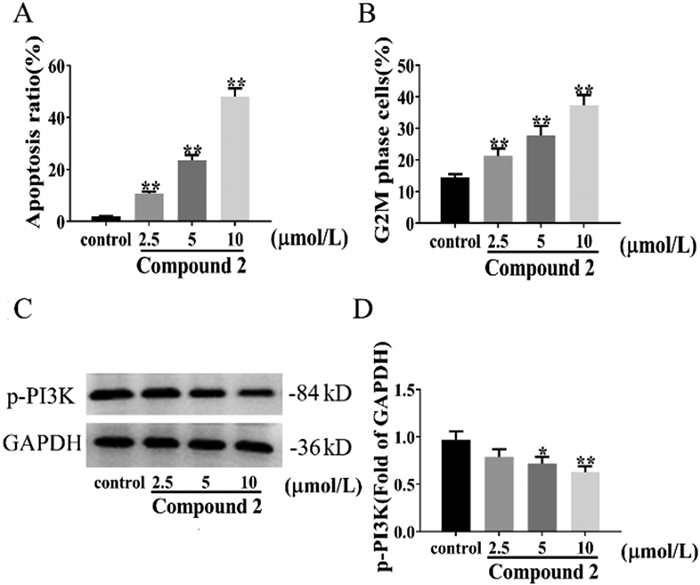
To investigate whether compound 2 inhibits cell cycle progression in HepG2 cells, they were treated with various concentrations of compound 2 for 24 h and then collected for cell cycle analysis (Fig. SE2 in Supporting information). The proportion of cells in the G2/M phase in the blank control group was 14.42% ± 1.10%. After drug intervention, the proportion of cells in the G2/M phase increased significantly (P < 0.01). The cell proportion increased to 21.32% ± 2.33%, 27.82% ± 2.97%, and 37.32% ± 3.26% at concentrations of 2.5, 5.0, and 10 µmol/L, respectively, which were 1.47, 1.93 and 2.59 times that of the blank control group (Fig. 6B). These results implied that compound 2 induces the arrest of the cell cycle of HepG2 cells in the G2/M phase in a dose-dependent manner.
Molecular docking methods showed that compound 2 was closely bound to the PI3K target (Table SE1 and Fig. SE3 in Supporting information), and the PI3K signaling pathway played a crucial role in regulating the cell cycle, proliferation, apoptosis and autophagy. To investigate the effects of the PI3K pathway in compound 2 induced apoptosis, the activation of PI3K was examined by Western blot, as shown in Fig. 6C. The treatment group with compound 2 caused a significant reduction in the expression of p-PI3K protein in a concentration-dependent manner (Fig. 6D). Compared with the control group, the difference was significant, suggesting that compound 2 inhibits activation of the PI3K signaling pathway in HepG2 cells.
In conclusion, two cadinane-derived sesquiterpenoid dimers with unprecedented carbon skeletons, hibisceusanols A (1) and B (2) were isolated and characterized from the stems of H. tiliaceus infected with the fungal pathogen F. oxysporum HK-27. This was the first time that such a structure has been observed in natural products. Compounds 1 and 2 displayed cytotoxic activities, and 2 showed a significantly higher anti-HepG2 effect than 1. The anticancer effect of 2 was generated via the induction of apoptosis in HepG2 cells by inhibiting the PI3K pathway, which is a good scaffold for candidates that can be further biosynthesized and pharmacologically tested. Nevertheless, further studies on biosynthetic pathways and the mechanism of action of 1 and 2 are necessary for better understanding these mechanisms. Our work is inspired by a series of studies on plant-microbial interactions and HNPs produced by these intricate defence systems in plants, which are a valuable resource in the discovery of potential pharmaceutical molecules for chemists to develop new drugs.
This case provides a new strategy for the discovery of HNP active molecules in the higher plant body through plant-microbial interactions, which could be induced by adverse stress in vivo and living factory production. The mining of HNPs will expand the source and compound library of natural active molecules and provide more opportunities for new drug development.
The authors declare that they have no known competing financial interests or personal relationships that could have appeared to influence the work reported in this paper.
This study was financially supported by the CAMS Innovation Fund for Medical Sciences (CIFMS) (Nos. 2021-I2M-1-032; 2021-I2M-1-071), the Key Research Project of Hainan Province (No. ZDYF2020111), and Project supported by the Research Fund for Development Program of Beijing City University (No. KYF202003).
Supplementary material associated with this article can be found, in the online version, at doi:
J. Hanson, Sci. Prog. 100 (2017) 63–79. doi: 10.3184/003685017X14876775256129
X.Y. Shao, S.J. Xu, X.F. Wan, et al., Chin. Chem. Lett. 34 (2023) 108349. doi: 10.1016/j.cclet.2023.108349
D.J. Newman, G.M. Cragg, J. Nat. Prod. 83 (2020) 770–803. doi: 10.1021/acs.jnatprod.9b01285
J.M. Winter, S. Behnken, C. Hertweck, Curr. Opin. Chem. Biol. 15 (2011) 22–31. doi: 10.1016/j.cbpa.2010.10.020
F.E. Koehn, G.T. Carter, Nat. Rev. Drug Discov. 4 (2005) 206–220.
A.G. Atanasov, S.B. Zotchev, V.M. Dirsch, et al., Nat. Rev. Drug Discov. 20 (2021) 200–216. doi: 10.1038/s41573-020-00114-z
K. Scherlach, C. Hertweck, Nat. Commun. 12 (2021) 3864. doi: 10.1038/s41467-021-24133-5
L.X. Chu, J.P. Huang, M. Muhammad, et al., Crit. Rev. Biotechnol. 40 (2020) 571–589. doi: 10.1080/07388551.2020.1751056
J. Fan, H.M. Ran, P.L. Wei, et al., Angew. Chem. Int. Ed. 135 (2023) e202217212. doi: 10.1002/ange.202217212
M. Klapper, A. Hübner, A. Ibrahim, et al., Science 380 (2023) 619–624. doi: 10.1126/science.adf5300
M.L. Timmermans, A.C. Ross, Trends Biotechnol. 38 (2020) 7–9. doi: 10.1016/j.tibtech.2019.11.003
D. Dehm, J. Krumbholz, M. Baunach, et al., ACS Chem. Biol. 14 (2019) 1271–1279. doi: 10.1021/acschembio.9b00240
J. Yu, X. Tu, A.C. Huang, Nat. Prod. Rep. 39 (2022) 1393–1422. doi: 10.1039/D2NP00010E
H. Zheng, X. Fu, J. Shao, et al., Trends Plant Sci. 28 (2023) 429–446. doi: 10.1016/j.tplants.2022.12.007
G. Polturak, M. Dippe, M.J. Stephenson, et al., Proc. Natl. Acad. Sci. U. S. A. 119 (2022) e2123299119. doi: 10.1073/pnas.2123299119
M.H. Yuan, Z.Y. Jiang, G.Z. Bi, et al., Nature 592 (2021) 105–109. doi: 10.1038/s41586-021-03316-6
E. Deboever, M. Deleu, S. Mongrand, et al., Trends Plant Sci. 25 (2020) 22–34. doi: 10.1016/j.tplants.2019.09.009
P.D. Sonawane, A. Jozwiak, S. Panda, et al., Curr. Opin. Plant Biol. 55 (2020) 118–128. doi: 10.1016/j.pbi.2020.03.008
C. Vanzella, P. Bianchetti, S. Sbaraini, et al., BMC Complement. Altern. Med. 12 (2012) 41. doi: 10.1186/1472-6882-12-41
D.L. Chen, G.X. Ma, E.L. Yang, et al., Bioorg. Chem. 127 (2022) 105982. doi: 10.1016/j.bioorg.2022.105982
D.L. Chen, M.Y. Chen, Y. Hou, et al., J. Nat. Prod. 85 (2022) 127–135. doi: 10.1021/acs.jnatprod.1c00849
C.B. Naman, J. Li, A. Moser, et al., Org. Lett. 17 (2015) 2988–2991. doi: 10.1021/acs.orglett.5b01284
C.F. Ding, H.F. Yu, X.L. Shi, et al., Tetrahedron Lett. 68 (2021) 152949. doi: 10.1016/j.tetlet.2021.152949
Y.P. Sun, L.T. Cui, Q.R. Li, et al., Chin. Chem. Lett. 33 (2022) 516–518. doi: 10.1016/j.cclet.2021.06.050
X.Y. Hu, X.M. Li, S.Q. Yang, et al., Chin. Chem. Lett. 34 (2023) 107516. doi: 10.1016/j.cclet.2022.05.030
I. Kubo, H. Muroi, A. Kubo, et al., Planta Med. 60 (1994) 218–221. doi: 10.1055/s-2006-959462
M.A. Ferreira, T.J. King, S. Ali, et al., J. Chem. Soc. Perkin Trans. 1 (1980) 249–256.
S. Ali, P. Singh, R.H. Thornson, J. Chem. Soc. Perkin Trans. 1 (1980) 257–259.

Figure 2 Global heatmap of transcript abundances of cadinane sesquiterpenoid pathway genes in un-treated controls (C) and pathogen infected (P) samples. (A) HtCDN; (B) HtADH; (C) HtODD; and (D) HtCYPs.

Figure 3 QTOF-MS total ion chromatogram analysis of pathogen-induced (red color) and healthy tissues (blue color) of dichloromethane extract and extracted ion chromatograms of 1 and 2 in infected and healthy tissues.

Figure 6 (A) Panel A shows the sum of the percentages of early and late apoptotic cells at each dose. (B) G2/M phase cell percentage data statistics. (C) Western blot analysis of phosphatidylinositol 3-kinase (PI3K) and glyceraldehyde 3-phosphate dehydrogenase (GAPDH) proteins in HepG-2 cells treated with compound 2 for 24 h. (D) Statistical results of the relative protein expression data for p-PI3K. Values are presented as mean ± standard deviation (SD) (n = 3). P < 0.05, **P < 0.01 versus the control group.

 扫一扫看文章

扫一扫关注我们
 DownLoad:

 下载:
下载:


 下载:
下载: