Citation:
Huan Liu, Longfeng Hu, Razium A. Soomro, Bin Xu. Organic salt-derived phosphorus-doped mesoporous carbon for high performance supercapacitors[J]. Chinese Chemical Letters,
2023, 34(8): 108004.
doi:
10.1016/j.cclet.2022.108004
Organic salt-derived phosphorus-doped mesoporous carbon for high performance supercapacitors
English
Organic salt-derived phosphorus-doped mesoporous carbon for high performance supercapacitors
College of Materials Science and Engineering, Xi'an University of Science and Technology, Xi'an 710054, China
b.
State Key Laboratory of Organic-Inorganic Composites, Beijing Key Laboratory of Electrochemical Process and Technology for Materials, Beijing University of Chemical Technology, Beijing 100029, China
* Corresponding author. E-mail address: xubin@mail.buct.edu.cn (B. Xu). 1 These authors contributed equally to this work.
Received Date:
24 October 2022 Accepted Date:
13 November 2022 Revised Date:
06 November 2022 Available Online:
15 August 2023
Abstract:
Phosphorus-doped mesoporous carbons (PMCs) were prepared using a self-doping and self-templating approach via direct pyrolysis of sodium phytate (C6H17NaO24P6). The one-pot method allows simultaneous carbonization and P doping, eliminating the need for pre-synthesis or post-activation treatment. The C6H17NaO24P6 is the source of both carbon and phosphorus, and the nano-Na4P2O7 particles produced during pyrolysis act as hard templates for the honeycomb mesoporous structure with high specific surface area (884–827 m2/g), large mesopore volume ratio (67%–75%) and rich phosphorus content (0.53–2.34 at%). As electrodes of supercapacitors in 6 mol/L KOH, the PMCs showed outstanding performance with a high capacitance of 202 F/g and excellent rate performance of 148 F/g at 30 A/g. In addition, the PMCs-based symmetrical supercapacitors can operate in an expanded working voltage of 0–1.6 V in 3 mol/L H2SO4 aqueous electrolytes with high-density energy of 11.8 Wh/kg.
New eco-friendly, low-cost, lightweight energy storage technologies are in demand for their use in wearable electronics, automobiles, portable gadgets, and power grids [1-5]. Supercapacitors are one of the most sophisticated energy storage devices, relying on the electrostatic adsorption on electrode/electrolyte interfaces of porous carbons or reversible surface redox reaction of metal oxides/conducting polymers, and can be divided into two types: non-faradaic electric double layer capacitors (EDLCs) and reversible faraday pseudocapacitors [6-10]. Supercapacitors have the advantages of high-power density and long cycle life, but the low energy density makes them unsuitable for diverse applications. The energy density could be improved by integrating specific capacitance and the working voltage of the supercapacitors. In general, the operating voltage relies on the electrochemical stability of the electrolyte. Aqueous electrolytes have good conductivity, non-toxicity, and wide availability, but their narrow electrochemical voltage window (less than 1 V) limits the energy density of the devised supercapacitors. Although organic and ionic liquid electrolytes have large voltage windows of up to 2.7 and 4 V, respectively, their limited ionic conductivity and high cost are major limitations to their use in supercapacitors devices [11-13]. Thus, engineering an electrode material that could realize high specific capacitance and work in an extended voltage window in an aqueous electrolytic system is in high demand for the practical usage of supercapacitors.
Due to their large specific surface area, tunable pore size, high conductivity, good chemical stability, and low cost, porous carbons have been widely used as electrode materials for EDLCs [14-18]. The capacitive performance of porous carbon depends on the specific surface area, pore size distribution, and surface chemistry. Although micropores (< 2 nm) are generally accessible to electrolyte solutions, it is not easy for fast ion transportation, resulting in the device's compromised rate capability. In contrast, mesopores (2–50 nm) can provide a more favorable path for ions transportation and good rate performance [9,14]. In addition, heteroatoms (N, O, P, S, etc.) doping in porous carbon matrix [19-23] has proven effective in improving the capacitive performance of porous carbons. In particular, P-doping in porous carbons can realize efficient pseudocapacitance. The P-heteroatom has a lower electronegativity and a larger atom size than carbon. Thus, doping P [24-26] in carbon could induce charge delocalization, resulting in structural disorders and a significant boost to the capacitance. Incorporating P atoms into porous carbons could be achieved using different routes. For example, Yang et al. synthesized P-doped three-dimensional hierarchical porous carbons via carbonization of a mixture consisting of glucose, manganese nitrate, and sodium hypophosphite [24]. Direct pyrolysis of P-containing compounds followed by post-activation also is an effective way to prepare P-doped porous carbons. Guo et al. prepared P-doped hierarchical porous carbon aerogels by carbonizing the phloroglucin-formaldehyde resins with phosphoric acid as a polymerization catalyst and following KOH activation [27]. Moreover, Huang et al. prepared P-rich carbons by using H3PO4 as an activation agent from waste coffee grounds resulting in porous structures with preserved phosphorus [28]. Although these routes are efficient, harsh chemical treatments and the generation of mesoporous carbons make them unsuitable. Thus, exploring simple, efficient, and scalable techniques to produce P-doped mesoporous carbons is still a challenge before heteroatom-doped carbons could be anticipated for high energy density supercapacitors.
Recently, we reported a simple, activation-free process to synthesize nitrogen-doped porous carbon materials using nitrogen-containing organic salt, i.e., tetrasodium salt of ethylenediaminetetraacetic acid (EDTA) as a precursor [29-31]. Herein, we propose a self-templating and self-doping method to produce phosphorus-doped mesoporous carbons (PMCs) using one-step pyrolysis of sodium phytate (C6H17NaO24P6). The one-pot approach allows the simultaneous incorporation of carbonization and P-atom doping, eliminating the requirement of any pre-synthesis treatment and post-activation process. The sodium phytate serves as the carbon and P sources, while the nano-Na4P2O7 particles formed during pyrolysis act as hard templates resulting in a honeycomb mesoporous structure. As electrode materials for supercapacitors, the produced PMCs exhibited outstanding electrochemical performances with a high capacitance of 202 F/g and an excellent rate performance of 148 F/g at 30 A/g in 6 mol/L KOH. Furthermore, the PMCs-based symmetrical system achieved an expanded working voltage of up to 1.6 V in 3 mol/L H2SO4 aqueous electrolytes, resulting in high-density energy of 11.8 Wh/kg.
Fig. 1a shows the schematic illustration of the one-pot synthesis of PMCs via direct pyrolysis of sodium phytate at different temperatures. During the thermal treatment, the sodium phytate is decomposed into composites of phosphorus-doped carbon matrix embedded with sodium-containing inorganic nanoparticles as the hard templates. Therefore, the self-doping (phosphorus-doping) and self-templating (sodium-containing inorganic nanoparticle as templates) are simultaneously realized during the carbonization of sodium phytate. The original products after carbonization without acid washing treatments were donated as NPMC. After washing with HCl, the inorganic nanoparticles are removed, and PMCs can be obtained. Figs. 1b and c show the SEM images of the porous carbon materials prepared at 600 and 900 ℃, respectively. A more developed honeycomb porous structure is evident for PMC-900 compared to its lower temperature counterparts. The corresponding TEM images (Figs. 1d and e) also confirm the formation of a stable (no structural collapse) and homogenous porous network for PMC-900. The corresponding pore diameter for PMC-900 was about 5–10 nm, suggesting relatively loose structural features compared to its PMC-600 counterpart.
Figure 1
Figure 1.
Preparation and porous structure of PMCs. (a) Schematic illustration of preparing PMCs from sodium phytate. SEM images of (b) PMC-600 and (c) PMC-900. TEM images of (d) PMC-600 and (e) PMC-900. (f) The N2 adsorption-desorption isotherms and (g) DFT pore-size distribution curves of PMCs.
N2 (77 K) adsorption-desorption tests were carried out to determine the porosity of PMCs prepared at 600–900 ℃. Type-IV isotherms with a distinctive hysteresis loop in the P/Po range of 0.5–0.9 were detected in all the cases (Fig. 1f), suggesting the developed mesoporous structure in all PMCs. The specific surface area (BET) and pore volume (Vt) of the PMCs are summarized in Table S1 (Supporting information). As the pyrolysis temperature increases from 600 ℃ to 900 ℃, the BET surface area (SBET) slightly decreases from 884 m2/g to 827 m2/g, while the total volume (Vt) increases from 0.93 cm3/g to 1.33 cm3/g. The pore size distribution curves estimated using density functional theory (DFT) confirmed the significant mesopores in the range of 2–50 nm with some micropores distribution of < 2 nm (Fig. 1g).
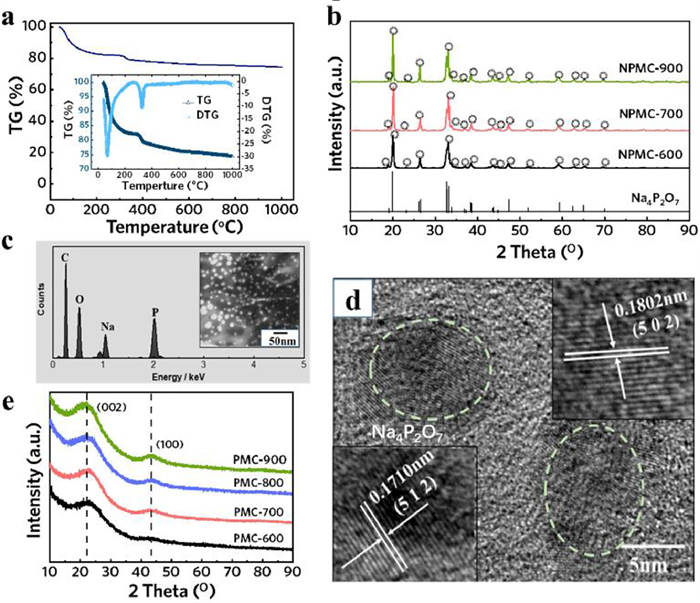
TGA, EDS and XRD were used to evaluate the precursor (sodium phytate) and the pyrolysis products to understand the pore generation mechanism and validate the composition of the pyrolysis products of sodium phytate. Fig. 2a shows the TGA of the precursor with the first weight loss of 18.5% near 200 ℃, associated with the dehydration and decomposition of the organic moieties. As the pyrolysis temperature rises, a weight-loss region ranging from 300 ℃ to 350 ℃ is observed, corresponding to the disintegration of carbonaceous complexes, the formation of inorganic salt nanoparticles, and the emission of small molecules gas. As the temperature increased, gradual weight loss was recorded with a residue of 75% at 1000 ℃. Furthermore, the XRD pattern (Fig. 2b) identifies the composition of carbonized products containing Na4P2O7 nanoparticles. The corresponding EDS spectrum confirm C, Na, P, and O as major elements in NPMC-900 (Fig. 2c). HRTEM further confirms the formation of a porous carbon network with evidence of Na4P2O7 particles. In the case of NPMC-900, the formation of the Na4P2O7@C composites is evident with typical fringe spacing for carbon and Na4P2O7 particles (Fig. 2d). Fig. 2e shows the XRD patterns of PMCs prepared at different temperatures. Two broad peaks near 23° and 43°, corresponding to (002) and (100) reflections, typical of amorphous carbon materials, were evident in all cases. As the pyrolysis temperature increases, the characteristic (100) gradually becomes evident, suggesting a higher graphitization degree for PMC-900. Based on these results, it is deduced that sodium phytate was decomposed during thermal treatment under an N2 atmosphere into a carbon matrix embedded with Na4P2O7 nanoparticles as hard templates. After being washed with diluted hydrochloric acid to remove Na4P2O7 nanoparticles, mesoporous carbons were finally obtained.
Figure 2
Figure 2.
Characterization. (a) The TG analysis of sodium phytate. (b) XRD patterns of NPMC, (c) the EDS result and (d) the HRTEM image of NPMC-900. (e) XRD patterns of PMCs.
XPS was used to analyze the surface chemical composition and binding state of PMCs generated at various temperatures, and the results are summarized in Table S1. Fig. S1 (Supporting information) shows the XPS survey of PMCs, and there are peaks centered at 132.3, 284.9 and 532.2 eV, corresponding to P 2p, C 1s and O 1s, respectively, confirming the P doping into carbon. As the carbonization temperature rises, the O content decreases while P increases from 0.53 at% at 600 ℃ to 2.34 at% at 900 ℃ (Fig. S2a and b in Supporting information). As shown in Fig. S2c (Supporting information), the major phosphorus binding energies were identified as C-O-PO3 (134.9 eV), C2-PO2/C-PO3 (133.5 eV) and C3-P (131.8 eV) [32,33]. Notably, PMC-900 has the strongest C3-P bonding signal, suggesting reduced phosphorus state increases as pyrolysis temperature rises. The P atoms can be doped in a porous carbon matrix during high temperature carbonization, eventually forming phosphorus-doped mesoporous carbon materials.
The electrochemical performances of the PMCs were evaluated in a 6 mol/L KOH aqueous solution. As shown in Fig. 3a, the CV curves of PMCs exhibit a quasi-rectangular shape, indicating a cumulative capacitive response from EDLC and the faradaic reaction. Fig. S3 (Supporting information) shows the CV curves for PMCs, recorded at different scan rates. A retained quasi-rectangular shape was observed at enhanced scan rates in all cases, confirming the electrode's excellent rate capability. The PMC-900 could maintain its quasi-rectangular shape even if the scan rate increases up to 3000 mV/s (Fig. S3d), suggesting its superiority in maintaining rate capability compared to its other counterparts. Fig. 3b shows the GCD curves recorded for PMCs at a current density of 1 A/g, linear V-t curves with little deviation at low voltage range, indicating double layer capacitive behavior with some contribution of pseudocapacitance arising from P-doping. Table S1 summarizes the capacitances of all samples at a current density of 0.1 A/g. PMC-700 exhibited a delayed discharging time, corresponding to the highest specific capacitance of 202 F/g at 0.1 A/g. Fig. 3d shows the IR drop pattern of the prepared PMCs. Among all, PMC-900 exhibited the smallest IR drop, reflecting the minimum internal resistance. This can be attributed to its relatively higher carbonization temperature, which facilitates improving conductivity.
Figure 3
Figure 3.
Electrochemical performances of the PMCs in 6 mol/L KOH aqueous electrolyte. (a) CV curves at 5 mV/s, (b) V-t curves at a current rate of 1 A/g, (c) the Nyquist plots, (d) V-t curves at a current rate of 30 A/g, and (e) rate performance of PMCs. (f) Capacitance retention performance of PMC-900 at 5 A/g.
Fig. 3c presents the EIS analysis to assess the charge-transfer kinetics of PMCs. The typical Nyquist plots consist of a compressed semicircle in the high-frequency region, a slope (ca. 45°) in the high-to-medium region, and a nearly vertical line in the low-frequency region, which indicates the capacitive behavior. The semicircle represents charge transfer resistance (Rct) at the electrode/electrolyte interface, whereas the slope range represents Warburg impedance, which corresponds to the diffusion of the electrolyte ions (K+ and OH−). The PMC-900 realized the smallest value crossing along the Z' axis, suggesting the lowest interfacial contact resistance based on its superior conductivity compared to other counterparts. Furthermore, the related slope was the sharpest with the lowest Warburg resistance, indicating that PMC-900 has a high ion diffusion rate. Fig. 3e shows the variation of specific capacitance against different current densities ranging from 0.1 A/g to 30 A/g. PMC-700 reaches the highest capacitance of 202 F/g at 0.1 A/g, which maintains 148 F/g at 30 A/g. In contrast, PMC-900 shows a capacitance of 170 F/g at 0.1 A/g, which slowly decreases to 136 F/g at a much-enhanced current density of 30 A/g with capacitance retention of as high as 80%, indicating its excellent rate performance. The cycling stability of PMC-900 was measured at a current density of 5 A/g (Fig. 3f). The capacitance retention of 92% was achieved after completing 5000 cycles, reflecting the material's robust capability to withstand long-term cyclability.
It is critical to improve the working voltage window of the PMC electrodes in an aqueous electrolyte to realize high energy density. In the case of PMC-900, the CV curves maintained a standard rectangular shape as the voltage window extended from 0–0.9 V to 0–1.6 V, while a minor divergence from ideal behavior was observed as the voltage range was extended to 0–1.7 V (Figs. 4a and b). In addition, the cycle stability of PMC-900 was examined in different working voltage windows. The specific capacitance of PMC-900 is stable under varied voltages in the range from 0–0.9 V to 0–1.6 V for multiple cycles (Fig. 4c). Thus, the PMC-900 can perform safely in H2SO4 aqueous electrolyte at a high voltage window of 1.6 V, much larger than 1 V of the conventional porous carbons. In contrast, PMC-700 was determined to maintain its standard rectangular shape near 1.2 V (Fig. S4a in Supporting information). The corresponding V-t curve also exhibited deviation when the working voltage reached 1.4 V. Thus, PMC-700 stable voltage window in the aqueous H2SO4 solution electrolyte was only 0–1.2 V (Fig. S4b in Supporting information). The high voltage window stability of PMC-900 may be ascribed to the higher graphitization degree and the higher content of P-doing, which favor for achieving stable carbon structure and provide more active sites for energy storge. Further investigation of PMC-900′s specific capacitance at different current densities demonstrates exceptional rate performance at the high working voltage of 0–1.6 V (Fig. 4e), whereas the capacitance of 171 F/g was achieved at 0.75 A/g which later maintained to 92 F/g when the current density reaches 30 A/g. In addition, capacitance retention of 90% was realized over 5000 cycles at the current density of 1 A/g in the wide voltage window of 0–1.6 V (Fig. S4c in Supporting information). Moreover, the device's power and energy density were computed within the different voltage windows. As shown in the Ragone plot (Fig. 4d), PMC-900 shows a maximum energy density of 11.8 Wh/kg with a power density of 203.5 W/kg (based on the mass of active materials) in the voltage window of 0–1.6 V. In addition, a maximum power density of 8422.6 W/kg can be retained with the energy density of 5.4 Wh/kg. PMC-900 shows much-enhanced energy and power density at a high cut-off voltage of 1.6 V, indicating the significance of increasing working voltage for supercapacitors. As shown in Table S2 (Supporting information) of the electrochemical performance of state-of-art P-doped porous carbons for supercapacitors, PMCs shows advantages for achieving high capacitance and energy/power density.
Figure 4
Figure 4.
Electrochemical capacitive performances of PMC-900 in 3 mol/L H2SO4 aqueous electrolytes. (a) CV curves at 5 mV/s and (b) GCD curves for voltage window at 1 A/g. (c) Galvanostatic cycling test of PMC-900 in a different voltage window. (d) Ragone plots and (e) the rate performance of PMC-900.
In conclusion, PMCs were synthesized using a self-doping and self-templating approach via direct pyrolysis of sodium phytate. The developed mesoporous honeycomb structure, large surface area, and phosphorus-doping enabled the as-prepared PMCs electrode to exhibit a high capacitance of 202 F/g at 0.1 A/g, with an excellent rate (148 F/g at 30 A/g) and cycling performance in KOH aqueous electrolyte. More importantly, the PMC-900 with high P atom content can stably operate at an extended working voltage range of 0–1.6 V in 3 mol/L H2SO4, providing a maximum energy density of 11.8 Wh/kg and power density of 8422.6 W/kg. This study provides a simple but very efficient route to prepare organic salt-derived porous carbons with a promising future towards porous carbon networks for energy-related applications such as batteries and catalysts.
Declaration of competing interest
The authors report no declarations of interest.
Acknowledgments
This work was supported by the National Natural Science Foundation of China (No. 52273274), State Key Laboratory of Organic-Inorganic Composites (No. oic-202101010), Natural Science Basic Research Project of Shaanxi Province (No. 2022JQ-123).
Supplementary materials
Supplementary material associated with this article can be found, in the online version, at https://doi.org/10.1016/j.cclet.2022.108004.
[1]
P. Zhang, B. Cao, R.A. Soomro, et al., Chin. Chem. Lett. 32 (2021) 282–285. doi: 10.1016/j.cclet.2020.10.006
[2]
B. Cao, H. Liu, P. Zhang, et al., Adv. Funct. Mater. 32 (2021) 2102126. doi: 10.1002/adfm.202102126
[3]
H. Liu, H. Du, W. Zhao, et al., Energy Storage Mater. 40 (2021) 490–498. doi: 10.1016/j.ensm.2021.05.037
[4]
H. Liu, L. Jiang, B. Cao, et al., ACS Nano 16 (2022) 14539–14548. doi: 10.1021/acsnano.2c04968
Figure 1
Preparation and porous structure of PMCs. (a) Schematic illustration of preparing PMCs from sodium phytate. SEM images of (b) PMC-600 and (c) PMC-900. TEM images of (d) PMC-600 and (e) PMC-900. (f) The N2 adsorption-desorption isotherms and (g) DFT pore-size distribution curves of PMCs.
Figure 2
Characterization. (a) The TG analysis of sodium phytate. (b) XRD patterns of NPMC, (c) the EDS result and (d) the HRTEM image of NPMC-900. (e) XRD patterns of PMCs.
Figure 3
Electrochemical performances of the PMCs in 6 mol/L KOH aqueous electrolyte. (a) CV curves at 5 mV/s, (b) V-t curves at a current rate of 1 A/g, (c) the Nyquist plots, (d) V-t curves at a current rate of 30 A/g, and (e) rate performance of PMCs. (f) Capacitance retention performance of PMC-900 at 5 A/g.
Figure 4
Electrochemical capacitive performances of PMC-900 in 3 mol/L H2SO4 aqueous electrolytes. (a) CV curves at 5 mV/s and (b) GCD curves for voltage window at 1 A/g. (c) Galvanostatic cycling test of PMC-900 in a different voltage window. (d) Ragone plots and (e) the rate performance of PMC-900.


 DownLoad:


 下载:
下载:


 下载:
下载:
