College of Food Science and Technology, Laboratory of Quality & Safety Risk Assessment for Aquatic Products on Storage and Preservation (Shanghai), Ministry of Agriculture and Shanghai Engineering Research Center of Aquatic-Product Processing & Preservation Shanghai Ocean University, Shanghai 201306, China
b.
School of Basic Medicine, Xinxiang Medical University, Xinxiang 453003, China
c.
Key Laboratory of Flexible Electronics (KLOFE) & Institute of Advanced Materials (IAM), Jiangsu National Synergetic Innovation Center for Advanced Materials (SICAM), Nanjing Tech University (NanjingTech), Nanjing 211816, China
d.
Department of Chemistry, FudanUniversity, Shanghai 200433, China
e.
Henry-Fork School of Food Sciences, Shaoguan University, Shaoguan 512005, China
Received Date:
13 August 2022 Accepted Date:
19 October 2022 Revised Date:
04 September 2022 Available Online:
15 August 2023
Abstract:
To achieve real-time monitoring of humidity in various applications, we prepared facile and ultra-thin CoAl layered double hydroxide (CoAl LDH) nanosheets to engineer quartz crystal microbalances (QCM). The characteristics of CoAl LDH were investigated by transmission electron microscopy (TEM), X-ray diffraction (XRD), X-ray photoelectric spectroscopy (XPS), Brunauer–Emmett–Telle (BET), atomic force microscopy (AFM) and zeta potential. Due to their large specific surface area and abundant hydroxyl groups, CoAl LDH nanosheets exhibit good humidity sensing performance. In a range of 11.3% and 97.6% relative humidity (RH), the sensor behaved an ultrahigh sensitivity (127.8 Hz/%RH), fast response (9.1 s) and recovery time (3.1 s), low hysteresis (3.1%RH), good linearity (R2 = 0.9993), stability and selectivity. Besides, the sensor can recover the initial response frequency after being wetted by deionized water, revealing superior self-recovery ability under high humidity. Based on in-situ Fourier transform infrared spectroscopy (FT-IR), the adsorption mechanism of CoAl LDH toward water molecules was explored. The QCM sensor can distinguish different respiratory states of people and wetting degree of fingers, as well as monitor the humidity in vegetable packaging, suggesting excellent properties and a promising application in humidity sensing.
Humidity monitoring is indispensable in many fields of life. As one of the main characteristics of human life, the humidity in the respiration can provide activity signals and indicate health-status [1,2]. For example, the high respiratory rate and sudden respiratory depth change often indicate the occurrence of certain diseases. Similarly, the skin moisture such as wound water level can reveal the health-status of skin [3,4]. Moreover, fruits and vegetables rich in moisture are easy to rot during storage, which can greatly shorten their shelf life [5–7]. Regarding to human health and food quality, therefore, it is significant to construct facile high performance humidity sensors to monitor the humidity.
In view of the high relative humidity in respiratory gas, as well as the fruit and vegetable packaging, humidity sensors should have good stability and fast response/recovery time even under high humidity. Recently, various humidity sensors have been developed, including paper-based sensor [8,9], optical microfiber/fiber [10,11], capacitance [12], surface acoustic wave (SAW) [13,14], quartz crystal microbalances (QCM) and so on. Amongst, QCM have been widely studied due to the advantages of low cost, easy operation, portability and high stability. In addition, based on Sauerbrey equation [15], QCM humidity sensor can sense the slight mass variations in a nanogram level, and thus humidity can be monitored online through the change of frequency, making it a fast, real-time, sensitive and accurate method.
To some extent, the sensing performance of QCM sensor is heavily dependent on the materials coated on the QCM chip. In recent years, a variety of materials have been developed to improve QCM humidity sensors, including Cu(OH)2 [16], metal oxides [17,18], carbon-based materials (carbon nanotubes, graphene oxides, cellulose nanocrystals) [19–22], polymers [23], bacterial cellulose membranes [24], black phosphorus [25], etc. Also, all kinds of composite materials are favored, such as metal oxide and polymer composite (PVA/ZnO) [26], metal oxide and carbon material composite (ZnO/GO) [27], carbon material and polymer composite material (GO/PANIs, RGO-PEO, GO/PEI) [28–30], metal-organic frameworks (MOFs) (ZnCo2O4/PPy) [31], MoS2/Cu(OH)2 [32], Cu(OH)2/GO [33]. Previous studies demonstrated that the performance of QCM humidity sensor mainly depend on the large specific surface area and abundant hydroxyl groups of the materials. CoAl layered double hydroxide (CoAl LDH) nanosheets can be a good candidate to fabricate QCM sensor. On the one hand, CoAl LDH can behave strong sorption toward water molecules due to the surface adsorption capacity. On the other hand, water molecules can be further captured and anchored on CoAl LDH because of the hydrogen-bond interaction between hydroxyl groups and water molecules [34,35]. Hence, it is interesting to develop a QCM humility sensor based on CoAl LDH with high sensitivity and stability toward water molecules.
In this work, super-hydrophilic CoAl LDH nanosheets were firstly synthesized by a rapid co-precipitation method, followed by characterizing the properties with TEM, XRD, XPS, BET, AFM, and zeta potential, respectively. Additionally, in-situ FT-IR was carried out to explore the adsorption mechanism between CoAl LDH nanosheets and water molecules. By simply drop-casting CoAl LDH nanosheets onto the silver surface of QCM, the humidity sensor was constructed (Scheme 1). The humidity properties of the sensor were explored under 11.3%–97.6% RH, and it shows a high sensitivity, fast response (9.1 s) and recovery time (3.1 s), low humidity hysteresis (3.1%), long-term stability and good selectivity. Importantly, the sensor can recover to the initial response stably even incubating with different volumes of water (0.1, 0.3, 0.5 and 0.7 µL), showing good repeatability under high humidity. The sensor was successfully applied to monitor human respiration, finger humidity and vegetable packaging humidity.
Scheme 1
Scheme 1.
Schematic presentation of the construction and application of CoAl LDH nanosheets modified QCM humidity sensor. (a) Synthesis of CoAl LDH via rapid coprecipitation method. (b) Construction QCM humidity sensor by drop-coating CoAl LDH. (c) Humidity detection of human respiration and fruits and vegetables in storage using QCM sensors.
As shown in Scheme 1a, CoAl LDH nanosheets were synthesized rapidly by coprecipitation. And the ultrathin CoAl LDH nanosheets were, and finally obtained by three times centrifugation and cleaning, respectively. These obtained four kinds of nanosheets with different Co/Al ratios were dispersed in deionized water to form 10 mg/mL solutions. They were still dispersed evenly in solution without precipitation after one month at room temperature, which indicated that they have excellent dispersibility and hydrophilicity (Fig. 1a). Meanwhile the CoAl LDH (A) nanosheets in water at a concentration of 10 mg/mL had a zeta potential of 39.83 mV (Fig. S2 in Supporting information), revealing that the material also has high stability and good hydrophilicity. As shown in Fig. 1b, the crystal structures of four kinds of CoAl LDH nanosheets were analyzed by XRD. The diffraction peaks located at 11.6° and 23.5°, corresponding to the (003) and (006) lattice planes of CoAl LDH (JCPDS No. 51-0045) [36]. It is demonstrated that four kinds of CoAl LDH nanosheets with different Co/Al ratios were generated successfully.
Figure 1
Figure 1.
(a) Photographs of homogeneous CoAl LDH nanosheets in H2O with a concentration of 10 mg/mL. (b) XRD pattern of the CoAl LDH nanosheets. (c, d) TEM images, (e, f) HRTEM images and (g-i) TEM mapping of CoAl LDH nanosheets (Co: Al = 1:1).
According to the TEM images (Figs. 1c–e), CoAl LDH show lamellar morphology, and most of them have hexagonal morphology. These nanosheets exhibit a certain transparency, which indicating that the nanosheets have had ultra-thin thickness. AFM (Fig. S3 in Supporting information) results shows that the thickness of the nanosheets is about 2 nm. The high-resolution TEM (HRTEM) (Figs. 1f and g) characterized the crystalline structure of CoAl LDH (A). The measured lattice fringe of 0.353 is attributable to its (006) crystal planes. In addition, TEM mapping of CoAl LDH (A) (Figs. 1g–i) displays the uniform distribution of Co, Al and O elements. The N2 adsorption/desorption isotherm (Fig. S4 in Supporting information) shows that the nanoplates have a large specific surface area of 43.738 m2/g, which can adsorb a large number of water molecules.
The valence state and distribution of CoAl LDH (A) were analyzed by the XPS measurements. Fig. S5a (Supporting information) displays the full scan spectrum of the CoAl LDH (A). The four characteristic peaks at 781.18, 531.69, 284.80 and 74.2 eV are attributed to Co 2p, O 1s, C 1s and Al 2p, respectively, which are consistent with previous research [37]. From the Co 2p spectrum (Fig. S5b in Supporting information), the Co element have two peaks at binding energies (BEs) of 979.28 eV and 781.28 eV, corresponding to Co 2p1/2 and Co 2p3/2, respectively. The peaks at the 796.98 eV and 781.28 eV are ascribed to Co3+, while the peaks at 798.18 and 782.88 eV are assigned to Co2+, suggesting that Co2+ and Co3+ are coexisting in CoAl LDH nanosheets. The spectrum of Al 2p (Fig. S5c in Supporting information) shows one peak with a BE of 73.35 eV, indicating that Al exhibits Al3+ valence in the materials. As shown in Fig. S5d (Supporting information), the spectrum for O 1s has two peaks at BEs of 532.28 and 531.48 eV, corresponding to the metal-oxygen bond and hydroxyl in CoAl LDH [38].
The humidity-sensing performance of QCM sensors based different Co/Al ratios (These sensors with different ratios of Co/Al (1:1, 2:1, 3:1 and 4:1) were marked as QCM-A, QCM-B, QCM-C and QCM-D, respectively. QCM-E represented QCM sensor without Co/Al LDH.) and unmodified bare QCM-E sensor were explored firstly. Fig. 2a shows dynamic response characteristics of the five sensors from low to high (11.3%, 32.8%, 57.6%, 75.5%, 85.5% and 97.6% RH), then high to low relative humidity levels at 25 ± 1 ℃ and 43 ± 1% RH. It was apparent that the frequency shift of all sensors raised with increasing RH, and could reached 5767 Hz, 5174 Hz, 4530 Hz and 4916 Hz under 97.6% RH, respectively. Among them, QCM-A has the highest response at every humidity, while QCM-E has almost no response, which indicates that the humidity sensitive material has better performance when the ratio of Co/Al is 1:1. The frequency shift of the sensor at each relative humidity minus the frequency shift at 11.3% RH was named ΔF'. Fig. 2c shows the relationship between the ΔF' and the corresponding relative humidity, through logarithmic linear fitting to the linear relationship in Fig. 2b, the fitting equations were y = 0.0113x + 2.7765, y = 0.0136x + 2.4719, y = 0.0165x + 2.0785 and y = 0.0147x + 2.3163 (where y is the value of frequency shift and x is the RH), respectively. Besides, all of them show good linearity (R2 > 0.99). The response and recovery time are defined as the time when the sensor reaches 90% of total frequency variation in the process of adsorption and desorption [29]. As shown in Fig. 2d, the response and recovery characteristics of the four QCM sensors at 11.3% RH were analyzed. The response times of the QCM-A, QCM-B, QCM-C, and QCM-D sensors were 3.1 s, 5.6 s, 6.4 s and 12.8 s, respectively. The recovery times of all the four sensors were all within 10 s, and among which the QCM-A had the fastest recovery time which was 2.2 s.
Figure 2
Figure 2.
(a) Frequency response curves of five sensors from low (RH = 11.3%) to high (RH = 97.6%) then high to low relative humidity levels at 25 ± 1 ℃ and 43% ± 1% RH. (b) Linear relationship between frequency shift of five sensors under different humidity minus frequency shift under 11.3% RH and corresponding humidity. (c) The logarithmic fitting curve of |ΔF'| vs. RH of four sensors. (d) Characteristic response and recovery curves of four sensors to 11.3% RH.
As shown in Table S1 (Supporting information), the material A (Co: Al = 1:1) has the highest response value (the sensitivity is 91.4 Hz/%RH) and the fastest response/recovery time (11.7/2.2 s), due to the abundant hydroxyl groups on the surface and the highest specific surface area (43.738 m2/g) of the material A.. Hence, material A with best sensing performance was selected to further study the relationship between the film thickness of the material and humidity sensitivity, QCM-A-X (1, 2, 3, 4, 5) represented different film thickness when the ratio of Co/Al was 1:1.
The linear relationship between the frequency shift and the humidity of the sensor with different film thickness was obtained as shown in Fig. 3a. Combined with sensors information in Table S2 (Supporting information), it is found that with the increases of film thickness, the frequency shift can achieve as high as 9519 Hz during a wide range from ambient humidity to 97.6% RH. The minimum response time of QCM-A-3 sensor was 9.1 s, the recovery time all within 10 s. Although QCM-A-4 and QCM-A-5 had higher sensitivity, they had longer response/recovery time and appeared overload in the later experiment of respiration, which is not suitable for practical application. Therefore, QCM-A-3 with high sensitivity (127.8 Hz/%RH) and fast response/recovery time (9.1 s/3.1 s) was selected as the best sensor to further study its stability and practical application characteristics. As shown in Fig. 3b, Humidity hysteresis property of the QCM-A-3 between low → high → low and high → low → high process was evaluated in the range of 11.3% RH and 97.6% RH. The maximum value of humidity hysteresis was 3.1% RH under 75.5% RH, which indicates that the QCM-A-3 sensor has excellent repeatability and practicability. As demonstrated in Fig. 3c, the 4 cycles repeatability test of QCM-A-3 in 4 cycles under 97.6% RH shows excellent repeatability with low fluctuation. Besides, Fig. 3d exhibits the sensor was tested once a week at 11.3%, 57.6% and 97.5% RH during five weeks, its variation was not obvious (within 90 Hz), revealing that the QCM-A-3 had a reliable long-term stability. Fig. 3e reveals the selectivity of the sensor towards 57.6% RH and 1000 ppm various gasses (carbon dioxide, ammonia, nitrogen dioxide, methylbenzene, formaldehyde, ethanol, acetic acid). Clearly, comparing with these interference gasses of 1000 ppm, the response value of QCM-A-3 sensor towards water molecules was much higher than them. It is demonstrated that the humidity sensor has great selectivity for water molecules. Fig. 3f shows the response/recovery time and sensitivity comparison between the sensor in this work and the previously reported QCM humidity sensors. The details performance information of these sensors is shown in Table S3 (Supporting information). It is found that the extremely high sensitivity of sensor in this work is obviously superior to the others, and the response/recovery time of the sensor is also relatively fast.
Figure 3
Figure 3.
(a) Linear relationship between frequency shift of six sensors and different humidity under 45% RH of test chamber. (b) Humidity hysteresis characteristic curve of the QCM-A-3. (c) Response curves of QCM-A-3 for 4 cycles at 97.6% RH. (d) Long-term stability of QCM-A-3 exposed to 11.3%, 75.5% and 97.6% RH. (e) Selectivity of the QCM-A-3 humidity sensor towards 57.6% RH and 1000 ppm various gasses. (f) Performance comparison of QCM humidity sensor between this work and reported works.
The sensor has outstanding self-evaporation, which means it has ability to stay working after being wetted [33]. In order to verify whether the sensitive film can work normally after being wetted under high humidity, 0.1, 0.3, 0.5 and 0.7 µL distilled water are dripped on QCM-A-3 in turn. The response value of QCM-A-3 sensor decreased when it was wetted, then recovered quickly after the moisture evaporates at room temperature (25 ℃), as shown in Fig. S6 (Supporting information). Although the recovery time becomes longer with the increase of droplet volume, it can eventually recover to the initial response value, presenting superior recovery ability under high humidity. Accordingly, the sensor has great application value in extreme humidity circumstances.
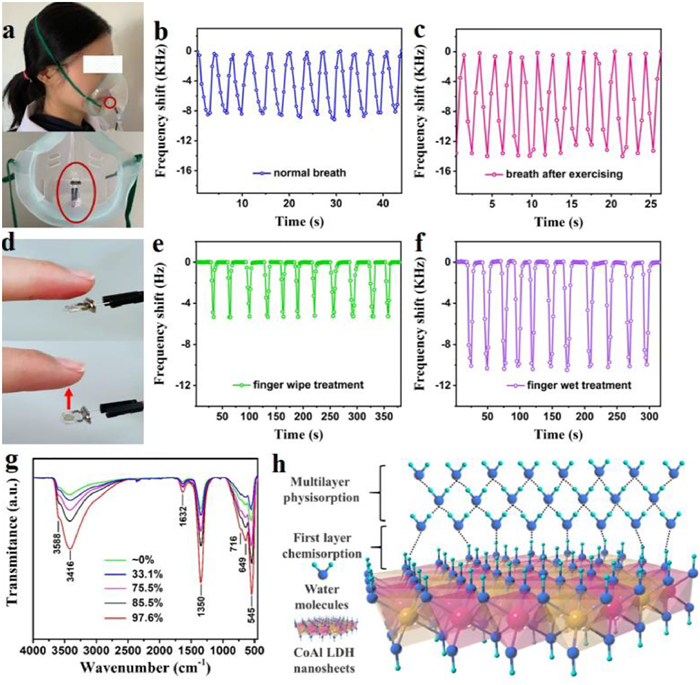
The humidity sensor can monitor the moisture in exhaled gas under different states of human body, and get different response signals, which can judge the related activities and healthy status of human body [1,2,33]. The analysis method diagram of the QCM-A-3 sensor in practical application of breath test was shown in Fig. 4a. In this analysis, the quartz chip was put in the respirator. The response characteristics of normal breathing (Fig. 4b) and breathing after running for 10 min (Fig. 4c) were studied by using the experimental device as shown in Fig. S7a (Supporting information). It is found that due to the extremely fast response/recovery time and high humidity stability of the QCM-A-3 sensor, the sensor can detect the relatively stable response values of breathing in peace (about 8500 Hz) and after exercise (about 13,500 Hz). It is worth noting that one cycle of normal breathing (about 3.5 s) is longer than that of breathing after exercise (about 2 s). Based on the above feature description, the state of human respirations in peace and after exercise can be clearly discriminated, demonstrating that the sensor has great application value in the accurate, fast and real-time monitoring of human body state and health. Certainly, we can also detect respiratory rate to judge health problems using this sensor when climbing mountains or diving.
Figure 4
Figure 4.
(a) Picture of a person wearing a breathing mask with QCM-A-3 sensor in practical application of breath test. The detailed position of the quartz chip in the respirator. The frequency response curves of the sensor to (b) normal breath and (c) breath after exercising. (d) Photograph of index finger detecting humidity on the QCM-A-3 sensor surface. The frequency response curves of the sensor to (e) dry index finger and (f) wet index finger. (g) In-situ FTIR of CoAl LDH nanosheets under different humidity conditions. (h) Schematic of humidity sensing at CoAl LDH nanosheets films.
Furthermore, the humidity sensor can also be used to detect the humidity of human skin to evaluate various physiology and metabolism [1,4]. The humidity monitoring of fingers staying at a height of 2 cm on the surface of quartz crystal chip for 5 s were studied as presented in Fig. 4d. The response characteristic curves of fingers under drying (wiped the finger with a paper towel before test) and wetting conditions are shown in Figs. 4e and f, respectively. When the finger was close to the sensor, the response value of the dry finger was nearly 5300 Hz, while the finger wetted with deionized water is about 11,000 Hz. It can be found that both finger humidity tests can complete within 11 s. The sensor has excellent sensitivity, repeatability and stability response performance to different humidity states of the finger, indicating that it has potential application in skin monitoring.
As shown in Fig. 4g, in-situ FT-IR was used to investigate the adsorption of water molecules on CoAl LDH nanosheets under different humidity conditions (~0, 11.3, 57.6, 85.5 and 97.6% RH). The peaks at 3600–3100 cm−1 were ascribed to the O—H stretching vibration from water molecules and H-bonded OH group in the interlayer [39]. The peaks at 1632 cm−1 belonged to the H—O—H (d-H2O) deformation vibration of interlayer water molecules [40]. The peaks at 1348 cm−1 could be attributed to the ʋ3 bending vibration of CO32− [41]. The peaks were assigned to vibration bands of metal-oxygen (M-O, M = Co, Al), M-O-M and O-M-O in the metal hydroxide layer below 800 cm−1 [42–44]. Obviously, the intensity and width of these peaks (3416, 1632 and below 800 cm−1) increased when humidity is raising, indicating that more and more water molecules were adsorbed on the hydroxyl of CoAl LDH nanosheets. Under low humidity, water molecules were adsorbed on the hydroxyl group of CoAl LDH nanosheets through hydrogen bonds to form the first layer of adsorption, which was also called chemisorption. With the increase of humidity, water molecules were physically adsorbed on two adjacent hydroxyl groups through hydrogen bonds to form multilayer physisorption water, as shown in Fig. 4h. It was an important factor for the material to have rapid adsorption and desorption capacity for water molecules.
Humidity control in fruits and vegetables is significance to maintain food quality and extend their shelf life of food [6,45]. However, it is difficult to dynamically monitor the internal humidity of packaging. Here, we designed a simple package based on QCM-A-3 sensor to monitor the humidity of cherry tomatoes stored in boxes sealed with plastic wrap, as shown in Fig. S7 (Supporting information). Thus, the humidity can be detected by inserting a prepared chip into the opening on one side of the packing box (its length and width are 20 cm and 10 cm, respectively). The sensor tested humidity before packaging, and then every three minutes for three times. The frequency shifts of the response values were 117.75, 1784.02, 3009.65, 3906.98 and 4602.43 Hz, respectively (Fig. S7), corresponding to humidity to be 50.8%, 72.2%, 82.7%, 88.9% and 93.1% RH, which was calculated by logarithmic fitting equation of QCM-A-3. It is noteworthy that the humidity inside the package was basically consistent with the ambient humidity when it was not encapsulated. After encapsulated, with the increase of time, the humidity generated by breathing of tomatoes in the packaging gradually decreased. The sensor has high sensitivity and stable real-time monitoring of humidity in cherry fruit packaging, demonstrating that the sensor can provide high practicability and convenience for the research and application of food humidity control [46,47].
Overall, we used the rapid co-precipitation method to prepare CoAl LDH nanosheets. TEM, XRD, XPS, BET, AFM and zeta potential were utilized to study the characteristics of the material, which shows that the nanosheets had ultra-thin thickness, large specific surface area, rich hydroxyl groups and super hydrophilicity. The QCM sensor based on the CoAl LDH nanosheets (Co: Al = 1:1) had high sensitivity (127.8 Hz/%RH), fast response/recovery time (9.1/3.1 s), high linearity (R2 = 0.9993), low hysteresis (3.1% RH@75.5% RH), good long-term stability and selectivity in the range of 11.3%–97.6% RH. The adsorption mechanism of water molecules on CoAl LDH sensitive film at different humidity levels was discussed by in-situ FT-IR. Furthermore, the sensor can distinguish human respiration in different states, humidity of fingers with different wetting degree and humidity in vegetable packaging with different storage time under real-time monitoring. In conclusion, this work reveals that CoAl LDH nanosheet has a very significant application prospect in humidity sensor.
Declaration of competing interest
The authors declare that they have no known competing financial interests or personal relationships that could have appeared to influence the work reported in this paper.
Acknowledgments
This work was supported by the Shanghai Natural Science Foundation (No. 21ZR1427500), the Agricultural Project of Shanghai Science and Technology Innovation Action Plan (No. 19391901600).
Supplementary materials
Supplementary material associated with this article can be found, in the online version, at doi:10.1016/j.cclet.2022.107930.
[1]
J. Wu, Y. Sun, Z. Wu, et al., ACS Appl. Mater. Interfaces 11 (2019) 4242–4251. doi: 10.1021/acsami.8b18599
[2]
J. Dai, H. Zhao, X. Lin, et al., ACS Appl. Mater. Interfaces 11 (2019) 6483–6490. doi: 10.1021/acsami.8b18904
[3]
S.D. Milne, I. Seoudi, H. Al Hamad, et al., Int. Wound J. 13 (2016) 1309–1314. doi: 10.1111/iwj.12521
[4]
W. Jeong, J. Song, J. Bae, K.R. Nandanapalli, S. Lee, ACS Appl. Mater. Interfaces 11 (2019) 44758–44763. doi: 10.1021/acsami.9b17584
Q. Chang, D. Wu, Y. Huang, et al., Sens. Actuator. B: Chem. 367 (2022) 132112. doi: 10.1016/j.snb.2022.132112
Scheme 1
Schematic presentation of the construction and application of CoAl LDH nanosheets modified QCM humidity sensor. (a) Synthesis of CoAl LDH via rapid coprecipitation method. (b) Construction QCM humidity sensor by drop-coating CoAl LDH. (c) Humidity detection of human respiration and fruits and vegetables in storage using QCM sensors.
Figure 1
(a) Photographs of homogeneous CoAl LDH nanosheets in H2O with a concentration of 10 mg/mL. (b) XRD pattern of the CoAl LDH nanosheets. (c, d) TEM images, (e, f) HRTEM images and (g-i) TEM mapping of CoAl LDH nanosheets (Co: Al = 1:1).
Figure 2
(a) Frequency response curves of five sensors from low (RH = 11.3%) to high (RH = 97.6%) then high to low relative humidity levels at 25 ± 1 ℃ and 43% ± 1% RH. (b) Linear relationship between frequency shift of five sensors under different humidity minus frequency shift under 11.3% RH and corresponding humidity. (c) The logarithmic fitting curve of |ΔF'| vs. RH of four sensors. (d) Characteristic response and recovery curves of four sensors to 11.3% RH.
Figure 3
(a) Linear relationship between frequency shift of six sensors and different humidity under 45% RH of test chamber. (b) Humidity hysteresis characteristic curve of the QCM-A-3. (c) Response curves of QCM-A-3 for 4 cycles at 97.6% RH. (d) Long-term stability of QCM-A-3 exposed to 11.3%, 75.5% and 97.6% RH. (e) Selectivity of the QCM-A-3 humidity sensor towards 57.6% RH and 1000 ppm various gasses. (f) Performance comparison of QCM humidity sensor between this work and reported works.
Figure 4
(a) Picture of a person wearing a breathing mask with QCM-A-3 sensor in practical application of breath test. The detailed position of the quartz chip in the respirator. The frequency response curves of the sensor to (b) normal breath and (c) breath after exercising. (d) Photograph of index finger detecting humidity on the QCM-A-3 sensor surface. The frequency response curves of the sensor to (e) dry index finger and (f) wet index finger. (g) In-situ FTIR of CoAl LDH nanosheets under different humidity conditions. (h) Schematic of humidity sensing at CoAl LDH nanosheets films.


 DownLoad:


 下载:
下载:


 下载:
下载:
