Enhanced rate capability and mitigated capacity decay of ultrahigh-nickel cobalt-free LiNi0.9Mn0.1O2 cathode at high-voltage by selective tungsten substitution
Citation:
Xingyuan Wang, Bao Zhang, Zhiming Xiao, Lei Ming, Minghuang Li, Lei Cheng, Xing Ou. Enhanced rate capability and mitigated capacity decay of ultrahigh-nickel cobalt-free LiNi0.9Mn0.1O2 cathode at high-voltage by selective tungsten substitution[J]. Chinese Chemical Letters,
2023, 34(7): 107772.
doi:
10.1016/j.cclet.2022.107772
Enhanced rate capability and mitigated capacity decay of ultrahigh-nickel cobalt-free LiNi0.9Mn0.1O2 cathode at high-voltage by selective tungsten substitution
English
Enhanced rate capability and mitigated capacity decay of ultrahigh-nickel cobalt-free LiNi0.9Mn0.1O2 cathode at high-voltage by selective tungsten substitution
Engineering Research Center of the Ministry of Education for Advanced Battery Materials, School of Metallurgy and Environment, Central South University, Changsha 410083, China
Received Date:
20 June 2022 Accepted Date:
22 August 2022 Revised Date:
23 July 2022 Available Online:
15 July 2023
Abstract:
Owing to the further requirement for electric vehicle market, it is appropriate to lower the cost and improve the energy density of lithium-ion batteries by adopting the Co-free and Ni-rich layered cathodes. However, their practical application is severely limited by structural instability and slow kinetics. Herein, ultrahigh-nickel cobalt-free LiNi0.9Mn0.1O2 cathode is elaborate designed via in-situ trace substitution of tungsten by a wet co-precipitation method following by high-temperature sintering. It is revealed that the in-situ doping strategy of high valence W6+ can effectively improve the structure stability by reducing irreversible phase transition and suppressing the formation of microcracks. Moreover, the transformed fine particles determined by W-doping can facilitate the kinetic characteristics by shortening Li+ diffusion paths. As expected, 0.3 mol% W-doped LiNi0.9Mn0.1O2 cathode exhibits a high specific capacity of 143.5 mAh/g after 200 cycles at high rate of 5 C in the wide potential range of 2.8-4.5 V, representing a potential next-generation cathode with low-cost, high energy-density and fast-charging capabilities.
Due to the large-scale application of electric vehicles (EVs), Li-ion batteries (LIBs) are developing rapidly owing to its high energy and power density [1-5]. Currently, the state-of-the-art LIBs are deficient in satisfying the short recharge mileage and high-rate energy storage, which are mainly limited by the high-cost and low energy density of cathode materials. Based on the synergistic effect of Ni-Co-Mn elements, LiNixCoyMn1-x-yO2 (NCM) has attracted much attention as cathode material for LIBs and has been applied to EVs [6-10]. In view of economic benefit and energy density, it is desirable to increase the Ni content in NCM cathode, accompanied with the gradually decrease of Co content, such as ultrahigh-nickel cobalt-free LiNi0.9Mn0.1O2 (NM90) [11]. However, Co-free cathodes, particularly Ni-rich materials, face serious technical challenges. Co is considered as an indispensable part in NCM cathode owing to its improved structural stability and enhanced rate performance by reducing the degree of Li+/Ni2+ mixing [12]. Additionally, Ni-rich content inevitably leads to the intensification of harmful phase transition from layered to spinel/rock-salt phases, and accumulation of inner stress within the high upper voltage range, easily inducing the continuous formation of microcracks within the secondary sphere particles [13-16]. What is worse, the generated microcracks provide a path for electrolyte infiltration, which accelerates the surface degradation by reacting with reactive Ni4+ to form a rock-salt impurity layer.
These issues greatly limit the practical use of Co-free cathodes. Hence, researchers have investigated a lot of methods for improving the cycling stability and rate capability, thus harnessing its high specific capacity of Co-free and Ni-rich cathodes. To date, metal-ions doping is an effective strategy to improve the electrochemical performance and structural stability of Ni-rich cathodes. Among the various doping elements (Zr, Ti, W, Mg, Nb, Y, Sr, B, Al, Mo, Sb, etc.) [17-21], W is a potential doping element for Ni-rich NCM materials. The most stable oxidation state of W is W6+ with the ionic radius of 0.60 Å, which is closest to Ni3+ (0.56 Å) in size and occupies the transition mental (TM) sites in the NCM cathode [22]. It is confirmed that W-doping can stabilize the bulk structure and reduce the internal strain form the irreversible phase transition, efficiently promoting the long-term cycling stability [23]. However, the variation of primary particle size after element-doping is always neglected, which requires comprehensive consideration of primary particles coarsening during calcination and maximum solubility of metal salts [24]. Besides, excess dopant atoms tend to assembling along the grain boundaries and impede the Li+ migration, illustrating that choosing the appropriate doping content is significantly important, which is still scarcely investigated. Especially for cobalt-free NM materials, stable electrochemical properties under harsh conditions remain a great challenge.
In this work, the introduction of in-situ W-doping into NM90 was achieved at precursor stage using a wet co-precipitation technology to enable uniform dispersion of dopant atoms. After calcination process, the size of primary particles decreases with the increased amounts of W6+ (0.3 and 0.7 mol%). More importantly, the influences of doping amount and particle refinement on reaction kinetics is explicitly unraveled. Moreover, the harmful side reaction and irreversible phase transitions have been alleviated after W-substitution. As anticipated, the suitable 0.3% W-doping for LiNi0.9Mn0.1O2 (NM90-W0.3) exhibits the excellent structure stabilization and reaction kinetics under harsh conditions of high voltage window (4.5 V) and large rate (5 C). This strategy is not only insightful for Co-free cathode design, but also beneficial for EVs industrial applications with fast-charging performance.
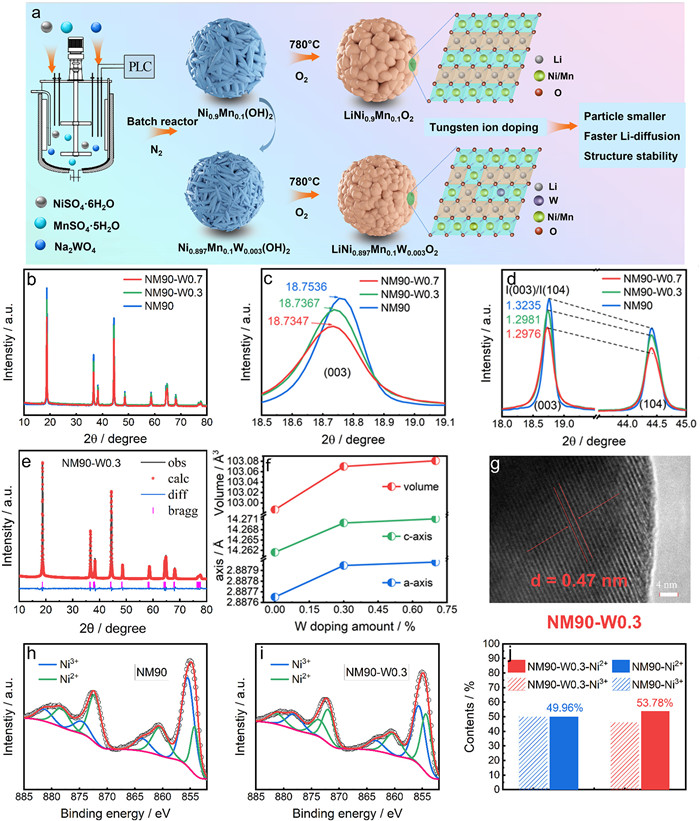
The fabrication process of in-situ W-doping on LiNi0.9Mn0.1O2 is schematically demonstrated in Fig. 1a, and the detailed information is presented in Supporting Information. In the preparation stage of precursor system, Ni, Mn and selective amount of W ions are co-precipitated and transformed into the hydroxide precursors. However, due to the limited solubility of W, only trace of W is incorporated into the crystal lattice, while partial W remains and accumulates on the surface of hydroxide, thus inhibiting the transverse growth of particle during the co-precipitation. Subsequently, the surface W will continuously diffuse into the lattice under the high-temperature sintering, completing the entire doping process, which can prevent the interdiffusion in the microstructures during the high sintering temperature of 780 ℃, thus decreasing the size of primary particle. The W-modified NM90 material not only provides rapid Li+-ion transfer channel, but also stabilize the layered structure.
Figure 1
Figure 1.
(a) Schematic diagram of tungsten-doping mechanism. (b) XRD full patterns, (c) enlarged (003) plane, (d) selected (003)/(104) planes for NM90, NM90-W0.3 and NM90-W0.7 samples. (e) Rietveld refinement of NM90-W0.3 sample. (f) Rietveld refinement parameters for NM90, NM90-W0.3 and NM90-W0.7 samples. (g) HRTEM images of NM90-W0.3 sample. XPS spectra of Ni 2p and their corresponding contents of Ni2+/Ni3+ for (h, j) NM90 and (i, j) NM90-W0.3.
X-ray diffraction (XRD) patterns of the pure and W-doped NM90 cathode materials are shown in Fig. 1b. The XRD patterns of all cathodes are indexed identically to a hexagonal crystal structure with the R-3m space group without impurity phases. Notably, the (003) diffraction peaks of NM90-W0.3 and NM90-W0.7 slightly move to a low angle (Fig. 1c), implying that the doping of W6+ strategy facilitates lithium ions transport with enlarged unit cell. Moreover, the (003)/(104) peak intensity ratio is closely related to the cation Li+/Ni2+ mixing [25], which is gradually decreased along with the increase of W-doping (Fig. 1d), indicating that the degree of Li+/Ni2+ cation mixing increases with the doping level of W6+. The structure and atomic occupancy were further identified by the XRD refinement results (Fig. 1e and Fig. S1 in Supporting information). It is noted that all parameters, including a-axis, c-axis and the unit cell volume, tend to increase with the amount of W6+ (Fig. 1f and Table S1 in Supporting information), likely attributing to the larger ionic radius of W6+ (0.60 Å) than that of Ni3+ (0.56 Å) [22]. Meanwhile, the refinement results display that the W6+ doping increases the degree of cation mixing (3.68 for NM90, 4.00 for NM90-W0.3 and 4.13 for NM90-W0.7), in agreement with the I(003)/I(104) results (Fig. 1d). The increased level of Li+/Ni2+ cation mixing can be attributed to the presence of W6+, which necessarily reduces Ni3+ to Ni2+ to maintain charge neutrality. It is confirmed that the appropriate mixing of Li+/Ni2+ can suppress the rapid structural change and weaken the electrostatic repulsion, thus stabilizing the crystal structure and promoting local migration of Li+-ions [26-28].
In addition, high resolution transmission electron microscopy (HRTEM) image in Fig. 1g shows that the surface of NM90-W0.3 material expresses clear lattice fringes. The interplanar distance is measured to be 0.47 nm, ascribing to the (003) plane of the hexagonal layered structure, suggesting that the W is doped into the crystal structure rather than coated on the surface. Furthermore, the chemical composition of as-prepared cathode materials was explored by X-ray photoelectron spectroscopy (XPS). The Ni 2p spectra of NM90 and NM90-W0.3 samples are shown in Figs. 1h and i, the Ni 2p1/2 and Ni 2p3/2 peaks are located at ~872.8 eV and ~855.1 eV, respectively, with corresponding satellite peaks at ~880.6 eV and ~860.7 eV [4,11,29]. Based on calculation, the fitting results show that the content of Ni2+ gradually increases (49.96% for NM90, 53.78% for NM90-W0.3) with the rising amount of W6+ doping (Fig. 1j), which is consistent with XRD analysis.
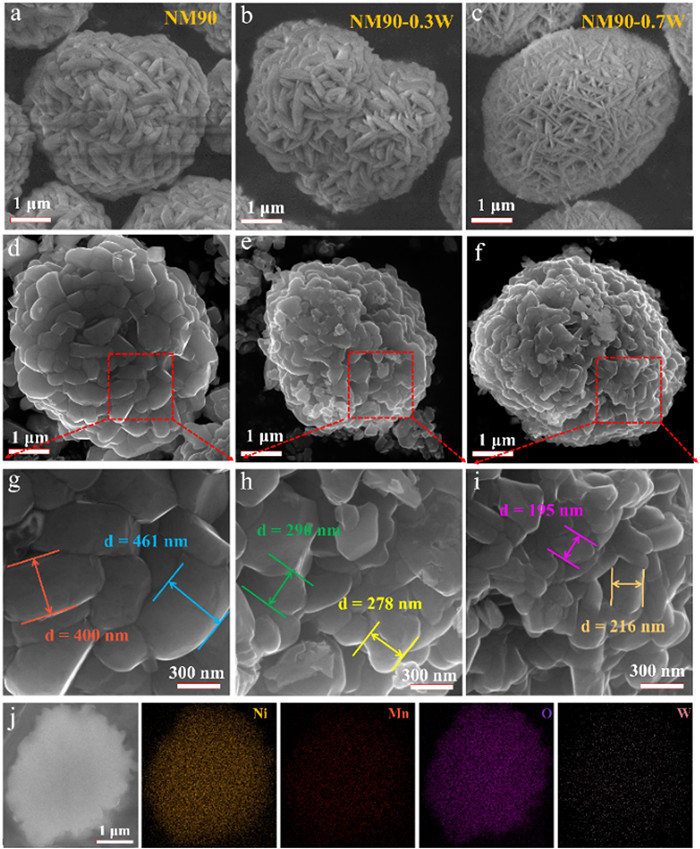
The scanning electron microscopy (SEM) images in Figs. 2a-c show the morphology of in-situ doped precursors samples, which present nearly spherical with a diameter of ~5 µm, whereas their primary particles display distinct differences. It can be clearly seen that the size of primary particles for as-prepared precursors gradually shrink to form a denser accumulation with the increasing of tungsten substitution. Interestingly, although the primary particles of cathodes are coarsened after high-temperature sintering, they still keep a similar trend with the corresponding precursors, as displayed in Figs. 2d-f. Specifically, the magnification SEM diagrams of NM90, NM90-W0.3 and NM90-W0.7 cathodes are presented in Figs. 2g-i, which clearly display the various primary particle sizes (~400 nm for NM90, ~290 nm for NM90-W0.3 and ~195 nm for NM90-W0.7), respectively. The results confirm that the NM90-0.7 presents the smallest size of primary particle contributed by the highest W-doping content. Furthermore, EDS mapping images in Fig. S3 (Supporting information) show that the elements are uniformly distributed on the surface of all cathodes. In order to better analyze distribution of metal elements, Fig. 2j demonstrates the EDS mapping of the cross-section images of NM90-W0.3 sample, which confirms the uniform distributed of Ni, Mn, O and W elements. It is worth noting that the W-ion is consistent with other metal elements, indicating that W-ion is uniformly doped into the crystal lattice.
Figure 2
Figure 2.
SEM images of (a-c) precursors. (d-f) SEM and (g-i) magnified SEM images of cathode material for NM90, NM90-W0.3 and NM90-W0.7 samples. (j) Cross-sectional SEM image and corresponding EDS mapping images of NM90-W0.3 cathode.
According to previous researches, particles refinement may be attributed to the formation of stronger W-O bonds than the original metal-O or excessive tungsten salts, which can inhibit the diffusion of elements matrix during calcination process [30,31]. However, the W-doping is usually applied during the high-temperature sintering process, which can hardly ensure the homogeneous distribution of W-substitution, instead by the partial wrapping of tungsten oxides on the NCM surface. Whereas, based on SEM images of the precursors (Figs. 2a-c), it is inferred that the in-situ doping during the wet co-precipitation process has a greater effect on particle morphology than that in the subsequent sintering process. Therefore, it is more likely that tungsten salts are evenly distributed along the primary particle boundaries, resulting in the particle refinement. Furthermore, the cathode can inherit the morphology from its precursors, which is conducive to control the structure growth with compacted secondary particles, with the aid of appropriate addition of tungsten salts. Compared to the pristine NM90, the smaller primary particles of W-doped cathode NM90-W0.3 can shorten the lithium ions transport paths to increase the diffusion rate, while its compact structure is beneficial to suppress the generation of cracks during the long-term delithiation/lithiation processes.
Typically, the structural morphology of cathode materials is closely associated with electrochemical properties. The effects of W6+-doping on electrochemical performance of as-prepared Co-free cathodes are studied by assembling coin-type half-cells. It is obvious that the NM90-W0.3 exhibits overwhelming advantages in the normal potential range of 2.8-4.3 V in comparison with pristine NM90 (Fig. S4 in Supporting information). In order to further increase the reversible capacity, the testing voltage window is escalated into 2.8-4.5 V. The initial charge and discharge curves at 0.1 C (1 C = 200 mAh/g) are displayed in Fig. 3a. Interestingly, the NM90-W0.3 cathode delivers an initial discharge capacity of 208.4 mAh/g with the coulomb efficiency of 93.1%, which is higher than that of NM90 with 191.2 mAh/g (the coulomb efficiency is 89.4%) and NM90-W0.7 with 189.38 mAh/g (the coulomb efficiency is 88.6%), respectively. The enhanced specific capacity of NM90-W0.3 is ascribed to the smaller primary particles induced by W6+ doping, which displays the shorter Li+ diffusion paths to reduce the polarization. However, excess W-doping, that is, ionic concentration exceeds solubility limit, will result in the residue tungsten oxides remaining at the interface among the primary particles, which hardly incorporates into the crystal structure of NM cathode. Thus, the redundant W-doping limits the migration of Li-ions in NM cathode, illustrating the relatively lower discharge capacity of NM90-W0.7.
Figure 3
Figure 3.
(a) Initial charge/discharge profiles at 0.1 C, cycling performance at 1 C of (b) specific capacity and (c) midpoint voltage for NM90, NM90-W0.3 and NM90-W0.7 samples. The dQ/dV profiles for (d) NM90 and (e) NM90-W0.3 samples. (f) Cycling property at 5 C and (g) rate performance of NM90 and NM90-W0.3 samples. The comparisons of (h) rate and (i) cycling properties with those of other cobalt-free cathode materials.
In Fig. 3b, the NM90-W0.3 cathode exhibits superior cycling stability at 1 C, achieving the high reversible capacity of 180.1 mAh/g with retention rate of 90.1% after 100 cycles. In contrast, the specific capacity of pristine NM90 (107.2 mAh/g) and NM90-W0.7 (176.4 mAh/g) are inferior than that of NM90-W0.3, suggesting the significance of appropriate W-doping amounts. Additionally, Fig. 3c displays the midpoint voltage of all cathodes, which display an obvious rising trend. Whereas, the midpoint voltage value changing of NM90-W0.3 (0.06 V for charging, 0.08 V for discharging) is smaller than that of NM90 (0.18 V for charging, 0.16 V for discharging) after 100 cycles at 1 C, implying that NM90-W0.3 electrode suffers less polarization. Meanwhile, to reveal the influence of W-doping strategy on electrochemical reaction reversibility during the long-term delithiation/lithiation process, differential dQ/dV curves of the 1st, 25th, 50th, 75th and 100th cycles were calculated at 1 C. The result of potential difference between NM90 (0.2129 V, Fig. 3d) and NM90-W0.3 (0.1622 V, Fig. 3e) also demonstrates the less polarization with limited irreversible capacity loss after W-doping.
In order to further evaluate the electrochemical properties under harsh condition, long-term cycling at high current density was performed. As exhibited in Fig. 3f, the NM90-W0.3 cathode achieves a reversible capacity of 143.5 mAh/g at 5 C after 200 cycles, corresponding to the capacity retention of 78.7%, while the NM90 cathode only obtains 85.2 mAh/g with the capacity retention of 48.7% after 100 cycles. The improved cycling stability of NM90-W0.3 is attributed to W-doping, which forms stronger W-O bonding in the layered structure and tighter spherical morphology. Moreover, the rate performance is demonstrated at various current densities in Fig. 3g. The NM90-W0.3 cathode delivers a higher reversible capacity in comparable with the pristine NM90 under the same current density. Even at ultrahigh rate of 10 C, the NM90-W0.3 cathode can achieve superior reversible capacity of 174.1 mAh/g (85.6% of the capacity at 0.2 C), much higher than that of pristine NM90 with 138.9 mAh/g (71.8% of the capacity at 0.2 C). Obviously, the controlled primary particles of NM90-W0.3 cathode is conducive to the Li+ transport, which provides a promising strategy for high power energy storage system. The rate capability between NM90-W0.3 and the reported Ni-rich Co-free NM cathodes is compared and displayed in Fig. 3h and Table S2 (Supporting information). Apparently, the ultrahigh rate property of NM90-W0.3 cathode overtakes previous results. Moreover, Fig. 3i demonstrates a crosswise comparison of the cyclic stability among our work and previous studies, further confirming the superior comprehensive electrochemical properties (Table S3 in Supporting information), which is an effective strategy to improve the performance of Co-free NM cathodes.
To confirm the influence of structure stability and kinetic characteristic by W-doping, the cyclic voltammetry (CV) was employed. As shown in Figs. 4a and b, both pristine NM90 and NM90-W0.3 cathodes undergo a serious of phase transitions at delithiation stage [32], including the original hexagonal structure (H1) transformation into the monoclinic (M), accompanied with two subsequent hexagonal phases (H2 and H3) with the increase of potential successively. Specifically, the unit cell expanded slowly in the c-direction with the transition from H1 to H2 phase, which is induced by the coulombic repulsion of the anion layers. Moreover, during the phase transition of H2 → H3 at ~4.2 V, an abrupt contraction occurs in the c-direction, thus the spherical structure is subjected to severe anisotropic stress at higher voltage. Contraction of the c-axis can be related to the formation of NiO2 layers during the oxidation process of Ni2+ to Ni4+ [33]. CV results demonstrate that the intensity of H2 → H3 phase transition for pristine NM90 cathode decreases rapidly during the first three cycles, indicating the severe deterioration of layered structure. In contrast, it is hardly observed the obvious decay of the H2 → H3 transition peaks for NM90-W0.3 cathode, confirming the stabilizing effect of W-doping on this layered structure [29,34].
Figure 4
Figure 4.
CV curves during the initial three cycles at 2.8-4.5 V for (a) NM90 and (b) NM90-W0.3. EIS spectra of NM90 and NM90-W0.3 at 1 C (c) before cycling, (d) after 10 cycles and (e) 30 cycles. SEM image, magnified SEM image and HRTEM image (inset of FFT image) for (f-h) NM9010 and (i-k) NM90-W0.3 cathodes after 100 cycles at 1 C.
Additionally, electrochemical impedance spectroscopy (EIS) tests of NM90 and NM90-W0.3 cathodes from initial state to 30 cycles were performed to study the mechanism on reaction kinetics. It is seen that the EIS curve is composed of a semicircle in the high-middle frequency region and a slash in the low frequency region, corresponding to the electron transport resistance (Rct) and Warburg impedance (Zw), respectively [35,36]. After fitting by equivalent circuit diagram (Fig. S5 in Supporting information), in the initial state (Fig. 4c), the Rct value of NM90-W0.3 is less than pristine NM90, confirming that the finer particles can facilitate the Li+ migration. Furthermore, the NM90-W0.3 achieves a higher Li+ diffusion coefficient with calculated DLi of 1.01 × 10⁻¹⁴ than that of pristine NM90 (Table S4 in Supporting information). After cycling, as displayed in Figs. 4d and e, the increased semicircle in the high frequency area can be attributed to the impedance of Li+ passing though the solid electrolyte films (Rf) [37]. The Rct of pristine NM90 cathode increases significantly during the extend cycling, whereas the NM90-W0.3 cathode exhibits a smaller increase. The stable Rct for NM90-W0.3 cathode implies that W ions inhibit the generation of microcracks to ensure the charge transport.
For intuitive verification of the effects of the harmful phase transitions (H2 → H3), the cycled electrodes (100 cycles at 1 C) of NM90 and NM90-W0.3 cathodes were tested by using SEM and HRTEM. As displayed in Fig. 4f, pristine NM90 contains several clear cracks, even the spherical secondary particle has been completely broken. Furthermore, the cracks easily occur along the grain boundary (Fig. 4g), which are attributed to the anisotropic stress during H2 → H3 phase transition. Significantly, the existence of cracks will expedite electrolyte infiltration, while the prolonged exposure to electrolyte unavoidably accelerates the surface degradation of NM90 cathode. Expectedly, its layered structure has been completely transformed into the rock-salt phase at the surface, confirmed by the corresponding FFT image (inset of Fig. 4h). In contrast, the spherical morphology of NM-W0.3 secondary particles still remain intact after the long-term cyclings (Fig. 4i). As magnified in Fig. 4j, it is hardly observed the obvious cracks within the particles. Additionally, NM90-W0.3 cathode shows clear layered structure at electrode surface (Fig. 4k), suggesting that the W-doping can minimize the surface degradation by inhibiting the formation of microcracks.
Herein, we propose the size controlling mechanism by W-doping for NM90 cathode, as displayed in Fig. S6 (Supporting information). The aforementioned results confirm that the primary particles structure of NM precursor and its corresponding cathode will change with the addition of extra W-element. It is attributed to that the W-compounds at the grain boundaries among primary particles act like a barrier to block Ni interdiffusion and hinder the growth of primary particles. Noticeably, morphology transformation is closely related to electrochemical characteristics, the finer primary particles can improve the mechanical strength and crack toughness of spherical secondary particles, achieving the cycling stability of Ni-rich cathodes, especially for the fast-charging performance with high-rate capability.
A series of W-doped Ni-rich Co-free cathodes have been fabricated and its substitution influence has been investigated. The in-situ wet doping strategy is adopted to ensure the even dispersion of W-elements during the synthetic process. Interestingly, the primary particles of LiNi0.9Mn0.1O2 are gradually refined with the increase of W-doping amount. It is noted that the appropriate doping content can achieve the particle size refinement, resulting in the effective improvement of Li+ diffusion. Furthermore, W6+ doping strategy can reduce microcracks by inhibiting harmful phase transition (H2 → H3), thus alleviating the erosion by electrolyte. As a result, the proposed NM90-W0.3 cathode exhibits an outstanding cycling stability at 5 C in the high potential range of 2.8-4.5 V. The delicate W-doing strategy with particle controlling provides an effective modification route for Co-free Ni-rich cathode materials, especially for the enhancement of their fast-charging performance.
Declaration of competing interest
The authors declare that they have no known competing financial interests or personal relationships that could have appeared to influence the work reported in this paper.
Acknowledgment
We gratefully acknowledge the financial support from the National Natural Science Foundation of China (Nos. 51908555, 52070194).
Supplementary materials
Supplementary material associated with this article can be found, in the online version, at doi:10.1016/j.cclet.2022.107772.
Figure 1
(a) Schematic diagram of tungsten-doping mechanism. (b) XRD full patterns, (c) enlarged (003) plane, (d) selected (003)/(104) planes for NM90, NM90-W0.3 and NM90-W0.7 samples. (e) Rietveld refinement of NM90-W0.3 sample. (f) Rietveld refinement parameters for NM90, NM90-W0.3 and NM90-W0.7 samples. (g) HRTEM images of NM90-W0.3 sample. XPS spectra of Ni 2p and their corresponding contents of Ni2+/Ni3+ for (h, j) NM90 and (i, j) NM90-W0.3.
Figure 2
SEM images of (a-c) precursors. (d-f) SEM and (g-i) magnified SEM images of cathode material for NM90, NM90-W0.3 and NM90-W0.7 samples. (j) Cross-sectional SEM image and corresponding EDS mapping images of NM90-W0.3 cathode.
Figure 3
(a) Initial charge/discharge profiles at 0.1 C, cycling performance at 1 C of (b) specific capacity and (c) midpoint voltage for NM90, NM90-W0.3 and NM90-W0.7 samples. The dQ/dV profiles for (d) NM90 and (e) NM90-W0.3 samples. (f) Cycling property at 5 C and (g) rate performance of NM90 and NM90-W0.3 samples. The comparisons of (h) rate and (i) cycling properties with those of other cobalt-free cathode materials.
Figure 4
CV curves during the initial three cycles at 2.8-4.5 V for (a) NM90 and (b) NM90-W0.3. EIS spectra of NM90 and NM90-W0.3 at 1 C (c) before cycling, (d) after 10 cycles and (e) 30 cycles. SEM image, magnified SEM image and HRTEM image (inset of FFT image) for (f-h) NM9010 and (i-k) NM90-W0.3 cathodes after 100 cycles at 1 C.

 DownLoad:


 下载:
下载:


 下载:
下载:
