Figure 1.
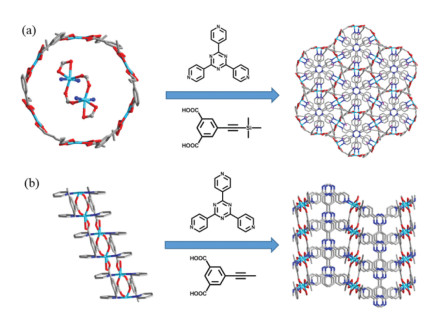
(a) The SBU contected with TPT and H2TEPA to form the complex 1 with 3D frameworks along c axis. (b) The SBU contected with TPT and H2EPA to form the complex 2 with 3D framworks along a axis.
Two alkynyl functionalized Co(Ⅱ)-MOFs as fluorescent sensors exhibiting selectivity and sensitivity for Fe3+ and nitroaromatic compounds
Yue Li , Xia Wang , Chengyong Xing , Xiurong Zhang , Zelong Liang , Xiaokang Wang , Kai Zhang , Yutong Wang , Di Liu , Weidong Fan , Fangna Dai

In recent years, the pollution of heavy metal ions has attracted widespread attention as an environmental issue with the development of industry and agriculture [1, 2]. Among these heavy metal ions, Fe3+ plays a vital role in organism and plants, such as helping blood transport oxygen to body cells, enabling cells to work energetically and conduce to plants growth. However, excessive Fe3+ also has certain harm to the environment [3-5]. At the same time, it is well known that nitroaromatic compounds are harmful to our health and cause methemoglobinemia, hemolysis, heinzbody and other diseases [6, 7]. Therefore, they must be detected in a quick and easy way and prevent their damage.
Metal-organic frameworks (MOFs), as new inorganic porous crystalline materials, are constructed by metal ions and organic ligands, which have been attracted wide attention in fluorescence sensing application with the structure advantages of high specific surface area, large porosity, open metal sites and so on [8-12]. MOFs combine the feature of various luminescence mechanisms and diversified host-guest interactions, different from other available sensors [13-17]. Compared with other detection methods, such as atomic absorption spectrophotometer, gas chromatography, ICP emission spectrometry, the method of fluorescence detection though MOFs due to convenient preparation, fast response time, and sensitive detection, have become a promising sensing to detect heavy metal ions and nitroarmatic compounds nowadays [18-21].
There are many reports on the fluorescence recognition of MOFs, but only a few examples of high sensitivity and selectivity MOFs as sensors are reported. Wen et al.reported two aminodecorated transition metal Zn-MOF and Cd-MOF, which can detect Hg2+ or Cr6+ through fluorescence quenching due to the energy transfer between the π and π* orbitals of 2-NH2bdc2- [22]. Li et al. have synthesized luminescent Ln-MOFs [Ln2(2, 3'-oba)3(phen)2]n constructed by lanthanide metals and two organic ligands, exhibiting selective and sensitive detection of Fe3+ and Cr6+ as well as metronidazole [23]. Sun's group synthesized highly luminescent-active MOFs effectively sensitizing visible-lightemitting Tb3+ ions by designing ligands adapted with various space-directed N donors [24]. Up to now, the main factors to improve selectivity and sensitivity of MOFs as fluorescent sensors can be summarized as follows: (1) Excellent luminescence properties of MOFs composed of luminescent metal ions and large conjugated organic ligands. (2) High specific surface area and large porosity are favorable for the adsorption of metal ions or small organic molecules in the detection. (3) Adjustable chemical functionality: by designing organic ligands with special functional groups, it is more likely to interact with host–guest system in fluorescence sensing, resulting in rapid changes in fluorescence intensity [25-28].
Herein, based on the design of ligands, two different ligands with alkynyl functional group 5-((triisopropylsilyl)ethynyl)isophthalic acid (H2TEPA) and 5-ethynylisophthalic acid (H2EPA) were synthesized. Two Co-MOFs with different structures were successfully synthesized though dual-ligand strategy introducing 2, 4, 6-tri (pyridin-4-yl)-1, 3, 5-triazine (TPT). Complexes 1 and 2 show excellent luminescence properties. Interestingly, as fluorescent sensors, they exhibit selectivity and sensitivity for Fe3+ and rapidly detect nitroaromatic compounds in methanol and ethanol, especially for 2, 4-NPH and 4-NA and 4-NP through fluorescence quenching with high quenching efficiency. Therefore, complexes 1 and 2 are promising sensors for identification and detection to Fe3+ and nitroaromatic compounds.
The two alkynyl functionalized ligands we designed are shown in Scheme S1 (Supporting information). Crystal data are shown in Table S1 (Supporting information). Complex 1 is constructed by ligand of TPT and H2TEPA (Fig. 1a). By single-crystal X-ray diffraction analysis, complex 1 crystallizes in the hexagonal crystal system with a space group R3. The asymmetric coordination unit consists of a Co2+ ion, two-thirds TPT ligands, one H2TEPA ligand and a DMF molecule in solvent. Co1 is six-coordinated with four carboxylic oxygen atoms from three different H2TEPA ligands, two nitrogen-atoms from two different TPT ligands. All the carboxyl groups of H2TEPA ligand were deprotonated during the reaction: one adopts bidentate mode to link a Co2+, one adopts chelating mode to connect a Co2+ and the groups adopt bridging mode to connect two Co2+ ions to form binuclear SBUs, and this binuclear SBUs connected with TPT, H2TEPA ligands form the threedimensional (3D) coordination network structure. Meanwhile, there are large conjugate system with π-π effect in this network structure (Fig. S5 in Supporting information). All Si atoms extend into the pore from the crystal plane of 010. In addition, by the SQUEEZE program in the PLATON software calculation [29], the porosity is 5.03% (757 Å out of the 15, 061 Å unit cell volume).
Complex 2 is constructed by ligand of TPT and H2EPA (Fig. 1b). Single-crystal X-ray diffraction result indicates that complex 2 crystallizes in the monoclinic system with a space group C2/c. The asymmetric coordination unit consists of a Co2+ ion, one TPT ligand and one H2EPA ligand. Every Co atom is six-coordinated with four carboxylic oxygen atoms from three different H2EPA ligands, two nitrogen-atoms from two different TPT ligands with an average Co-O distance of 2.048 Å, Co-N distance of 2.163 Å. Each μ2-carboxylate group of the fully deprotonated carboxylic acid ligands links two Co ions to form binuclear SBU. Furthermore, ligands and SBU are connected to each other, thus 3D structure with conjugate structure is formed through the connection between layers and the porosity is 10.03% (1510 Å out of the 15, 061 Å unit cell volume) (Fig. S6 in Supporting information).
MOFs constructed by transition metal ions have relatively fine luminescence performance [30]. Therefore, the two Co-MOFs were experimented of solid state fluorescence. As expected, complexes 1 and 2 exhibited different luminescence properties relative to ligands (Fig. S10 in Supporting information). Complex 1 exhibits clear emission at λmax = 457 nm upon excitation at λex = 330 nm with EXslit = 5.0 nm, EMslit = 2.5 nm, which has a red-shift of 30 nm compared to the ligand of H2TEPA at λmax = 427 nm. Complex 2 shows the same phenomenon of red shift compared to complex 1. This change in emission wavelength can be attributed to cobalt ions in MOFs influences the electron transition containing π→π* and n→π* in the original ligand. The fluorescence lifetime and luminescence quantum yield of two complexes are shown in Table S4 and Fig. S11 (Supporting information). It is precisely because of the luminescent properties of the two complexes, luminescence in different solvents was measured, complexes 1 and 2 showed different luminescence intensities (Figs. S12 and S13 in Supporting information). Complexes 1 and 2 show a stable and high fluorescence intensity in methanol solution and ethanol solution as relatively green organic solvents. Therefore, the next fluorescence sensing experiment was carried out in methanol solution and ethanol solution, respectively. The measurement procedures are as follows: 2 mg of solvent-free complex 1 was dispersed by ultrasonication in 3 mL of methanol solution. During the fluorescence testing, then 10 μL of methanol solution of M(NO3)x (1.0 mmol/L; M = Li+, Ag+, Ba2+, Ca2+, Cd2+, Cu2+, Mg2+, Pb2+, Hg2+, Cr3+, Al3+ and Fe3+) were added to the solution in turn in each set of experiments. The corresponding fluorescence intensity were recorded in fluorescence spectrophotometer. When 150 μL of M(NO3)x was adding, the corresponding fluorescence intensity is showed in Fig. 2a. It is obvious that Fe3+ can reduce the fluorescence intensity of the complex 1 to the greatest extent relative to the other metal ions (Figs. S18–S20 in Supporting information), and the decreasing trend of fluorescence intensity is shown in Fig. 2b.
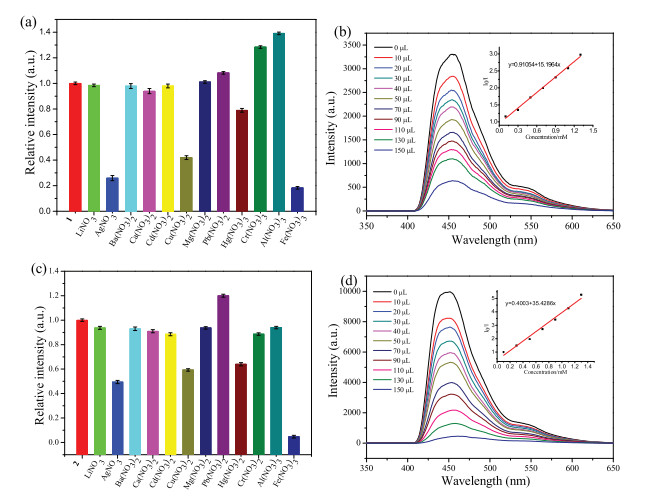
To further compare the difference between metal ions in the properties of complexes 1 and 2 constructed by different ligands, the fluorescence experiment method of complex 2 is the same as described above. Fe3+ can also reduce the fluorescence intensity of the complex 2 to the greatest extent, (Fig. 2c and Figs. S21–23 in Supporting information) and the decreasing trend of fluorescence intensity was shown in Fig. 2d. In order to further prove the quenching efficiency of complexes 1 and 2 for Fe3+, we calculated the quenching constant (Ksv) by the Stern - Volmer (SV) equation, (I0/I) = 1 + Ksv [A] [31]. Here, I0/I is stand for the initial fluorescence intensity over the luminescence intensity after addition of the analyte, [A] is the molar concentration of the analyte. The Ksv value of complex 1 was calculated to be 1.520 × 10⁴ L/mol towards Fe3+ while 3.543 × 10⁴ L/mol for complex 2, which is higher than the known MOF-based sensors Eu(acac)3@Zn(C15H12NO2)2 (5 × 10³ L/mol), [32] [Cd(TEB)0.5]·2DMF·4H2O (6.9 × 10³ L/mol) [33], lower than MIL-53(Al) (9 × 10⁵ L/mol) [34]. To estimate the luminescence properties of two complexes, the limit of detection (LOD) is necessary. The detection limit (LOD) is calculated based on the equation: LOD = 3σ/k, s value is calculated from 11 groups of blank test and K value is based on the linear regression, so, the LOD of complexes 1 and 2 are 0.616 mmol/L and 0.264 mmol/L for Fe3+, respectively. Fe3+ can induce significant fluorescence quenching of complexes 1 and 2, which indicating that 1 and 2 can be used as sensors to detect Fe3+ selectively and sensitively. At the same time, fluorescence intensity of the complexes 1 and 2 can be quenched based on Fe3+, we attribute the reasons to the following: (1) both ligands contain electron-absorbing groups -C≡C- and pyridine ring are easily interacted with Fe3+; (2) Fe3+ with relatively small radius easily enter the channel and interact with MOFs to change the fluorescence intensity [35, 36]; (3) these two three-dimensional MOFs with conjugate structure possessing π→π interaction, which tends to cause energy transfer.
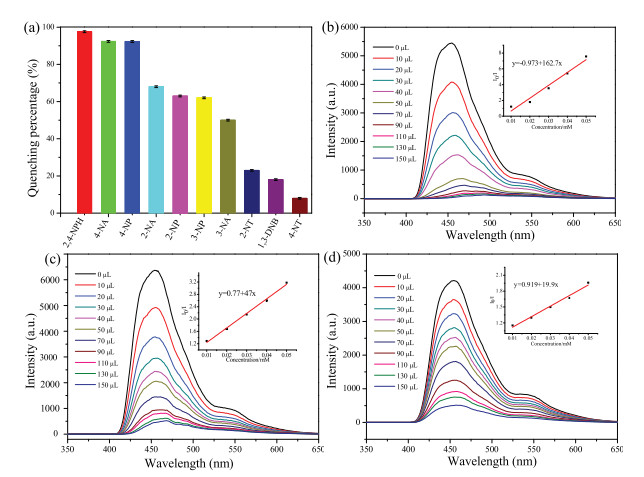
As well known that nitroaromatic compounds with strong carcinogenic toxicity and acute toxicity to liver, lungs and many other organs are very harmful to humans and our environment [37-39]. Hence, it is significant to detect their presence to prevent harm to humans and society. In order to study the application of complexes 1 and 2 in the identification of nitroaromatic compounds, we also tested the fluorescence spectra by fluorescence spectrophotometer. In the measurement, 2 mg of 1 and 2 removing the solvent were added to 3 mL of methanol and ethanol, respectively, and different nitroaromatic compounds including 2-dinitrotoluene (2-NT), 4-dinitrotoluene (4-NT), 1, 3-dinitrobenzene (1, 3-DNB), 2-nitrophenol (2-NP), 3-nitrophenol (3-NP), 4-nitrophenol (4-NP), 2-nitroaniline (2-NA), 3-nitroaniline (3-NA), 4-nitroaniline (4-NA) and 2, 4-dinitrophenylhydrazine (2, 4-NPH) were added in each set of standard solution. All nitroaromatic compounds can cause fluorescence quenching of complex 1, but there are difference between these nitroaromatic compounds (Fig. 3a). It is obvious that 2, 4-NPH can maximumly reduce the fluorescence intensity of complex 1 to nearly 100%. The quenching percentage of 4-NA and 4-NP can reach above 90%. The change of the fluorescence spectra of the 2, 4-NPH, 4-NA and 4-NP to quench complex 1 is shown in Figs. 3b–d.
For complex 2, the result of identifying nitroaromatic compounds is similar to 1. The degree of quenching of 1 arranged from high to low is shown in Fig. 4a. As shown in the figure, The quenching percentage of 2, 4-NPH to complex 2 reached 96.5%. For 4-NA and 4-NP, the fluorescence quenching percentage to complex 2 reached 94.1% and 92.3%, respectively. The corresponding fluorescence spectra are displayed in Figs. 4b–d.
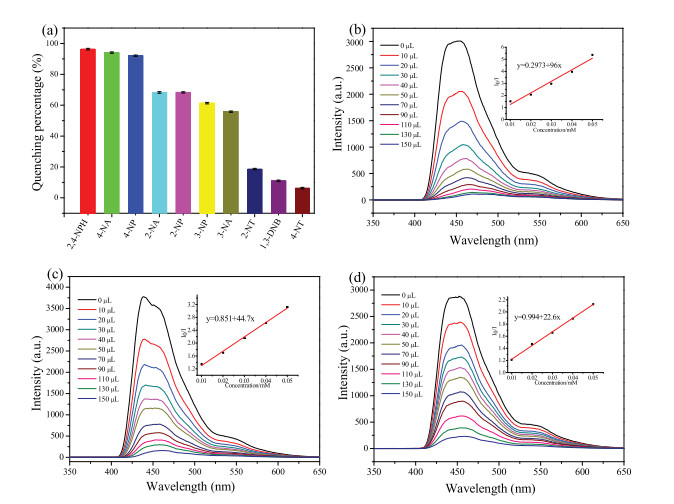
The Stern–Volmer (SV) plot was used to calculate the quenching efficiency of complexes 1 and 2 for nitroaromatic compounds, the Ksv value of complex 1 was calculated to be 1.627 × 10⁵ L/mol towards 2, 4-NPH, the highest among 4-NA (4.7 × 10⁴ L/mol), 4-NP (1.99 × 10⁴ L/mol) and other nitroaromatic compounds (Figs. S24 and S25 in Supporting information). The calculated LOD are about 0.0575, 0.199, and 0.470 mmol/L, respectively. The Ksv value of complex 2 was calculated to be 9.6 × 10⁴ L/mol towards 2, 4-NPH, higher than 4.47 × 10⁴ L/mol towards 4-NA, 2.26 × 10⁴ L/mol towards 4-NP. (Figs. S26 and S27 in Supporting information). The calculated LOD are about 0.0975, 0.209, and 0.414 mM, respectively. In these NACs including 2, 4-NPH, 4-NA, 4-NP, nitrogen atoms in the groups -NO2, -NHNH2-, -NH2 as strong electron withdrawing group have electron-withdrawing effect, therefore, the mechanism of fluorescence quenching can be attributed to energy transfer between NACs with H2TEPA and H2EPA ligands, affecting the role of π→π* and n→π* in MOF skeleton.
In summary, on the premise of alkynyl functional design of organic ligands, two Co-MOFs with different structures were successfully constructed. Interestingly, complexes 1 and 2 show excellent luminescence properties. Moreover, as fluorescent sensors, in methanol and ethanol, complexes 1 and 2 exhibit selectivity and sensitivity for Fe3+ with the Ksv of 1.520 × 10⁴ L/mol and 3.543 × 10⁴ L/mol, respectively, at the same time, which can also rapidly detect nitroaromatic compounds, especially for 2, 4-NPH and 4-NA and 4- NP throughfluorescence quenching with high quenching efficiency. The Ksv value of complexes 1 and 2 towards 2, 4-NPH can reach up to 1.627 × 10⁵ L/mol and 9.600 × 10⁴ L/mol, demonstrating that metalorganic frameworks can be used as fluorescent sensors with great prospects in identifying metal ions and nitroaromatic compounds. A further research on the use of these ligands to synthesize other MOFs with fluorescent properties is the next work in our laboratory.
This work was supported by the National Natural Science Foundation of China (NSFC, No. 21771191), the Taishan Scholar Foundation (No. ts201511019), the Shandong Natural Science Fund (No. ZR2017QB012), the Fundamental Research Funds for the Central Universities (Nos. 16CX05015A, 18CX06003A, YCX2018071).
Supplementary material related to this article canbefound, in the online version, at doi:https://doi.org/10.1016/j.cclet.2019.03.014.
P. Horcajada, T. Baati, G. Ferey, et al., Chem. Rev. 112(2012) 1232-1268. doi: 10.1021/cr200256v
S.A.A. Razavi, M.Y. Masoomi, A. Morsali, Inorg. Chem. 56(2017) 9646-9652. doi: 10.1021/acs.inorgchem.7b01155
L. Hyman, K. Franz, Coord. Chem. Rev. 256(2012) 2333-2356. doi: 10.1016/j.ccr.2012.03.009
J.D. Haas, T. Brownlie IV, J. Nutr. 131(2001) 676S-690S. doi: 10.1093/jn/131.2.676S
K.C. Abhijeet, S.N. Sanjog, J. Biplab, K.G. Sujit, Cryst. Growth Des. 13(2013) 3716-3721. doi: 10.1021/cg400749m
S. Shanmugaraju, P.S. Mukherjee, Chem. Commun. 51(2015) 16014-16032. doi: 10.1039/C5CC07513K
S.S. Nagarkar, B. Joarder, A.K. Chaudhari, S. Mukherjee, S.K. Ghosh, Angew. Chem. Int. Ed. 52(2013) 2881-2885. doi: 10.1002/anie.201208885
O.M. Yaghi, H. Li, M. Eddaoudi, M. O'Keeffe, Nature 402(1999) 276-279. doi: 10.1038/46248
Z.S. Han, W. Shi, P. Cheng, Chin. Chem. Lett. 29(2018) 819-822. doi: 10.1016/j.cclet.2017.09.050
G. Huang, Y.Z. Gang, H.L. Jiang, Acta Chim. Sin. 74(2016) 113-129. doi: 10.6023/A15080547
J.D. Xiao, H.L. Jiang, Acc. Chem. Res. 52(2019) 356-366. doi: 10.1021/acs.accounts.8b00521
K. Chen, C.D. Wu, Chin. Chem. Lett. 29(2018) 823-826. doi: 10.1016/j.cclet.2017.09.040
F.Y. Yi, D.X. Chen, M.K. Wu, L. Han, H.L. Jiang, ChemPlusChem 81(2016) 675-690. doi: 10.1002/cplu.201600137
Y.L. Hu, M.L. Ding, X.Q. Liu, L.B. Sun, H.L. Jiang, Chem. Commun. 52(2016) 5734-5737. doi: 10.1039/C6CC01597B
S.A. Diamantis, A. Margariti, M.J. Manos, et al., Inorg. Chem. Front. 5(2018) 1493-1511.
W.D. Fan, Y.T. Wang, Q. Zhang, et al., Chem.-Eur. J. 24(2018) 2137-2143.
W.D. Fan, X. Wang, Ben Xu, et al., J. Mater. Chem. A 6(2018) 24486-24495. doi: 10.1039/C8TA07839D
M.E. Walsh, Talanta 54(2001) 427-438. doi: 10.1016/S0039-9140(00)00541-5
X.C. Sun, Y. Wang, Y. Lei, Chem. Soc. Rev. 44(2015) 8019-8061. doi: 10.1039/C5CS00496A
S. Pramanik, Z.C. Hu, J. Li, et al., Chem.-Eur. J. 19(2013) 15964-15971. doi: 10.1002/chem.201301194
Y.L. Wu, G.P. Yang, Y.Y. Wang, et al., Dalton Trans. 44(2015) 3271-3277. doi: 10.1039/C4DT03415E
L.L.Wen, X.F.Zheng, K.L.Lv, C.G.Wang, X.Y.Xu, Inorg.Chem.54(2015)7133-7135. doi: 10.1021/acs.inorgchem.5b00098
J.M. Li, R. Li, X. Li, CrystEngComm 20(2018) 4962-4972. doi: 10.1039/C8CE00915E
F.Y. Yi, J.P. Li, D. Wu, Z.M. Sun, Chem.-Eur. J. 21(2015) 11475-11482. doi: 10.1002/chem.201500595
X.S. Zeng, H.L. Xu, D.R. Xiao, et al., Inorg. Chem. Front. 5(2018) 1622-1632.
Y. Cui, Y. Yue, G. Qian, B. Chen, Chem. Rev. 112(2012) 1126-1162. doi: 10.1021/cr200101d
S. Shanmugaraju, S.A. Joshi, P.S. Mukherjee, J. Mater. Chem. 21(2011) 9130-9138. doi: 10.1039/c1jm10406c
X. Sun, Y. Wang, Y. Lei, Chem. Soc. Rev. 44(2015) 8019-8061. doi: 10.1039/C5CS00496A
A.L. Spek, PLATON, A Multipurpose Crystallographic Tool, Utrecht University, The Netherlands, 2001.
S.C. Lv, B. Shanmugavelu, S.F. Zhou, et al., Adv. Optical Mater. (2018) 1800881.
G.G. Hou, Y. Liu, Q.K.Liu, J.P. Ma, Y.B.Dong, Chem. Commun.47(2011)10731-10733. doi: 10.1039/c1cc14115e
Z. Hu, B.J. Deibert, J. Li, Chem. Soc. Rev. 43(2014) 5815-5840. doi: 10.1039/C4CS00010B
X. Wang, W.D. Fan, D.F. Sun, et al., Chin. Chem. Lett. 30(2019) 801-805. doi: 10.1016/j.cclet.2018.12.009
C.X. Yang, H.B. Ren, X.P. Yan, Anal. Chem. 85(2013) 7441-7446. doi: 10.1021/ac401387z
W.P. Lustig, S. Mukherjee, S.K. Ghosh, et al., Chem. Soc. Rev. 46(2017) 3242. doi: 10.1039/C6CS00930A
J.M. Cole, M. Irie, CrystEngComm 18(2016) 7175. doi: 10.1039/C6CE90146H
H. Bai, H. Yuan, S. Wang, et al., Angew. Chem. Int. Ed. 54(2015) 13208-13213. doi: 10.1002/anie.201504566
F.M. Wang, W. Liu, J. Li, et al., Chem. Commun. 52(2016) 10249. doi: 10.1039/C6CC05290H
S.Y. Zhang, W. Shi, P. Cheng, et al., J. Am. Chem. Soc. 137(2015) 12203. doi: 10.1021/jacs.5b06929

Figure 1 (a) The SBU contected with TPT and H2TEPA to form the complex 1 with 3D frameworks along c axis. (b) The SBU contected with TPT and H2EPA to form the complex 2 with 3D framworks along a axis.

Figure 2 (a) The relative fluorescence intensity of complex 1 when adding twelve different metal ions. (b) Effect on the emission spectra intensity of 1 as the addition of Fe3+. Inset: Stern-Volmer plot of I0/Iversus the Fe3+ concentration in methanol solution. (c) The relative fluorescence intensity of complex 2 when adding twelve different metal ions. (d) Effect on the emission spectra intensity of 2 as the addition of Fe3+. Inset: Stern-Volmer plot of I0/I versus the Fe3+ concentration in ethanol solution.

Figure 3 (a) The quenching percentage of complex 1 when adding nitroaromatic compounds. (b–d) Effect on the emission spectra intensity of 1 as the addition of 2, 4-NPH, 4- NA, 4-NP. Inert: Stern-Volmer plot of I0/I versus the 2, 4-NPH, 4-NA, 4-NP concentration in methanol solution.

 扫一扫看文章

扫一扫关注我们
 DownLoad:
 下载:
下载:

 下载:
下载: