 Figure Scheme 1.
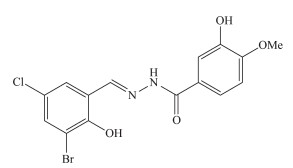
Structure of H2L
Figure Scheme 1.
Structure of H2L
Citation:
LI Lu-Xi, SUN Ying, XIE Qing, SUN Yu-Bing, LI Kun-Hua, LI Wei, YOU Zhong-Lu. A Maltolato-Coordinated Oxovanadium (Ⅴ) Complex Derived from N′-(3-Bromo-5-chloro-2-hydroxybenzylidene)-3-hydroxyl-4-methoxybenzohydrazide: Synthesis, Crystal Structure, and Insulin-Enhancing Activity[J]. Chinese Journal of Inorganic Chemistry,
2016, 32(2): 369-376.
doi:
10.11862/CJIC.2016.040

一个基于N′-(3-溴-5-氯-2-羟基苯亚甲基)-3-羟基-4-甲氧基苯甲酰肼的甲基麦芽酚配位的氧钒 (Ⅴ) 配合物:合成、晶体结构及其胰岛素增强活性
摘要:
制备了1个芳酰腙化合物:N′-(3-溴-5-氯-2-羟基苯亚甲基)-3-羟基-4-甲氧基苯甲酰肼 (H2L),并利用元素分析、红外、紫外、高分辨质谱、核磁共振氢谱和碳谱对其进行了表征。利用H2L与甲基麦芽酚和VO (acac)2在甲醇中反应得到了1个甲基麦芽酚配位的氧钒 (Ⅴ) 配合物[VO (mat) L]·MeOH。通过元素分析、红外和紫外光谱对其进行了表征,同时还研究了配合物的热稳定性。通过单晶X射线衍射进一步确认了H2L和配合物的结构。通过对C2C12肌细胞的胰岛素模拟实验,表明该配合物能显著促进细胞对葡萄糖的利用,其细胞毒性仅为0.07 g·L-1。
English
A Maltolato-Coordinated Oxovanadium (Ⅴ) Complex Derived from N′-(3-Bromo-5-chloro-2-hydroxybenzylidene)-3-hydroxyl-4-methoxybenzohydrazide: Synthesis, Crystal Structure, and Insulin-Enhancing Activity
Abstract:
An aroylhydrazone compound, N′-(3-bromo-5-chloro-2-hydroxybenzylidene)-3-hydroxyl-4-methoxyben-zohydrazide (H2L), was prepared and characterized by elemental analysis, IR, UV, HRMS, 1H NMR and 13C NMR spectrum. Reaction of H2L, maltol (3-hydroxy-2-methyl-4-pyrone) and VO (acac)2 in methanol afforded a maltolato-coordinated oxovanadium (Ⅴ) complex, [VO (mat) L]·MeOH. The complex was characterized by elemental analysis, IR and UV spectra. Thermal analysis was also performed. Structures of H2L and the complex were further confirmed by single crystal X-ray diffraction. Insulin-mimetic tests on C2C12 muscle cells indicate that the complex significantly stimulated cell glucose utilization with cytotoxicity at 0.07 g·L-1. CCDC: 1437202, H2L; 1437201, the complex.
-
Key words:
- oxovanadium complex
- / maltol
- / aroylhydrazone
- / crystal structure
- / insulin-enhancing activity
-
Since 1980s, inorganic vanadium salts and vanadium complexes with various ligands have been reported to possess potent pharmacological effects of insulin-mimetic activity[1-4]. Studies indicated that vanadium compounds improve not only hyperglycemia in human subjects and animal models of type Ⅰ diabetes but also glucose homeostasis in type Ⅱ diabetes[5-6]. However, the inorganic vanadium salts are considered as less active and more toxic. In order to reduce the side effects of inorganic vanadium salts, vanadium complexes with various organic ligands have received particular attention and demonstrated to be effective[7-9]. Among the complexes, bis (maltolato) oxov-anadium (Ⅳ) (BMOV)[10], synthesized by simple meta-thesis of vanadyl sulfate trihydrate and maltol (3-hydroxy-2-methyl-4-pyrone), has important and inter-esting insulin-enhancing activity[11-12]. Yet, there are some side effects of BMOV, principally diarrhea[13]. Schiff bases play important role in biological chem-istry. Several vanadium complexes derived from Schiff bases have shown to normalize blood glucose level with high efficiency and low toxicity, even at low concentration[14-15]. Schiff bases with hydrazone type are of particular interest due to their biological properties[16-20]. In view of the increasing importance of vanadium complexes with hydrazone type Schiff bases, we report herein the synthesis, characterization, and insulin-enhancing activity of a maltolato-coordinated oxovanadium (Ⅴ) complex with the aroylhydrazone compound N′-(3-bromo-5-chloro-2-hydroxybenzylidene)-3-hydroxyl-4-methoxybenzohydrazide (H2L, Scheme 1).
Figure Scheme 1.
Structure of H2L
1 Experimental
1.1 Materials and measurements
Starting material, reagents and solvents were purchased from commercial suppliers and used as received. Elemental analyses were performed on a Perkin-Elmer 240C elemental analyzer. IR spectra were recorded on a Jasco FT/IR-4000 spectrometer as KBr pellets in the 4 000~400 cm-1 region. Electronic spectra were recorded on a Lambda 10 spectrometer. Absorbance was recorded on a Bio-Tek model ELx800 96-well plate reader. HRMS data was obtained with ESI (electrospray ionization) mode. 1H NMR and 13C NMR were recorded on Bruker 300 MHz and 75 MHz spectrometer, respectively. X-ray diffraction was carried out on a Bruker SMART 1000 CCD diffractometer.
1.2 Preparation of H2L
To a methanolic solution (20 mL) of 3-bromo-5-chlorosalicylaldehyde (0.470 g, 2.0 mmol) was added a methanolic solution (20 mL) of 3-hydroxyl-4-methoxybenzohydrazide (0.364 g, 2.0 mmol) with stirring. The mixture was stirred for 10 min at room temperature and filtered. Upon keeping the filtrate in air for a few days, colorless block-shaped crystals of the compound, suitable for X-ray crystal determination, were formed at the bottom of the vessel on slow evaporation of the solvent. The crystals were isolated, washed three times with MeOH and dried in a vacuum desiccator containing anhydrous CaCl2. Yield: 78%. Anal. Calcd. for C15H12BrClN2O4(%): C, 45.08; H, 3.03; N, 7.01. Found (%): C, 44.92; H, 3.13; N, 7.12. IR data (KBr, cm-1): 3 429 m, 3 206 w, 1 641 s, 1 605 s, 1 569 m, 1 526 w, 1 443 s, 1 362 w, 1 316 m, 1 257 s, 1 217 s, 1 167 m, 1 132 w, 1 025 w, 976 w, 947 w, 870 w, 822 w, 763 w, 699 m, 633 w, 562 w, 480 w. UV-Vis (methanol, λ/nm (ε/(L·mol-1·cm-1))): 295 (18 725), 308 (20 150), 337 (12, 750), 407 (1 153). HRMS (ESI): m/z Calcd. for C15H11BrClN2O4 [M+] 398.974 2; Found: 398.973 9. 1H NMR (300 MHz, DMSO-d6): δ 12.83 (s, 1H, OH), 12.34 (s, 1H, NH), 9.38 (s, 1H, OH), 8.50 (s, 1H, CH=N), 7.69 (dd, 1H, J=12.7, 2.5 Hz, ArH), 7.66 (s, 1H, ArH), 7.47 (s, 1H, ArH), 7.44 (dd, 1H, J=12.5, 5.0 Hz, ArH), 7.08 (d, 1H, ArH), 3.85 (s, 3H, CH3). 13C NMR (75 MHz, DMSO-d6): δ 162.59, 153.23, 151.24, 146.33, 132.76, 129.16, 124.40, 123.17, 120.43, 119.70, 114.95, 111.41, 110.73, 55.73.
1.3 Preparation of the complex
A methanolic solution (30 mL) of VO (acac)2 (0.27 g, 1.0 mmol) was added to a methanolic solution (20 mL) of H2L (0.40 g, 1.0 mmol) and maltol (0.13 g, 1.0 mmol) with stirring. The mixture was stirred at room temperature for 30 min to give deep brown solution. The resulting solution was allowed to stand in air for a few days until three quarters of the solvent was evaporated. Brown block-shaped single crystals of the complex, suitable for X-ray single crystal diffraction were formed at the bottom of the vessel. The crystals were isolated by filtration, washed three times with cold methanol and dried in a vacuum desiccator containing anhydrous CaCl2. Yield: 53%. Anal. Calcd. for C22H19BrClN2O9V (%): C, 42.50; H, 3.08; N, 4.51. Found (%): C, 42.65; H, 3.22; N, 4.38. IR data (KBr, cm-1): 3 456 w, 1 619 m, 1 587 s, 1 531 m, 1 500 m, 1 451 m, 1 428 m, 1 366 m, 1 338 w, 1 259 s, 1 236 w, 1 202 s, 1 185 s, 1 131 m, 1 091 w, 1 022 m, 974 s, 946 m, 927 w, 850 m, 834 m, 812 w, 758 m, 733 s, 711 m, 637 m, 604 m. UV-Vis (acetonitrile, λ/nm (ε/(L·mol-1·cm-1))): 280 (27 360), 352 (15 333), 437 (8 130).
1.4 Crystal structure determination
Diffraction intensities for H2L and the complex were collected at 298(2) K using a Bruker SMART 1000 CCD area-detector diffractometer with Mo Kα radiation (λ=0.071 073 nm). The crystals with dimen-sions of 0.30 mm×0.27 mm×0.26 mm for H2L and 0.23 mm×0.22 mm×0.18 mm for the complex were mounted on the top of thin glass fibers. The collected data were reduced with SAINT[21], and multi-scan absorption correction was performed using SADABS[22]. Structures of H2L and the complex were solved by direct methods, and refined against F2 by full-matrix least-squares methods using SHELXTL[23]. All non-hydrogen atoms were refined anisotropically. The amino hydrogen atom in H2L was located from a difference Fourier map and refined isotropically, with N-H distance restrained to 0.090(1) nm. The remaining hydrogen atoms were placed in calculated positions and constrained to ride on their parent atoms. Crystallographic data for H2L and the complex are summarized in Table 1. Selected bond lengths and angles are given in Table 2.
 Table 1.
Crystallographical and experimental data for H2L and the complex
Table 1.
Crystallographical and experimental data for H2L and the complex
H2L The complex Formula C15H12BrClN2O4 C22H19BrClN2O9V Formula weight 399.63 621.69 Crystal system Monoclinic Triclinic Space group P21/c P1 a/nm 1.799 2(2) 0.801 83(5) b/nm 0.727 23(6) 1.280 37(8) c/nm 1.222 0(1) 1.301 01(8) α/(°) 90 103.909(1) β/(°) 97.287(2) 92.437(1) γ/(°) 90 106.885(1) V/nm3 1.586 0(2) 1.231 5(1) Z 4 2 Dc/(g·cm-3) 1.674 1.677 μ/mm-1 2.781 2.188 F(000) 800 624 θrange/(°) 3.02-25.03 1.72-25.50 Index range (h, k, l) -19~21=-8~8=-14~14 -9~9,-14~15=-12~15 Measured reflections 2 805 4 552 Observed reflections [I≥2σ(I)] 1 934 3 531 Absorption correction Multi-scan Multi-scan Min. and max. transmission 0.489 2 and 0.531 7 0.633 0 and 0.694 1 Data, restraints, parameters 2 805, 1, 214 4 552, 0, 330 Goodness-of-fit on F2 1.032 1.017 R1, wR2(I≥2σ(I))* 0.039 9, 0.082 2 0.031 3, 0.074 1 R1, wR2(all data)* 0.071 7, 0.094 0 0.047 1, 0.081 5 Largest diff. peak and hole/(e·nm-3) 491 and-467 389 and-326 *R1=∑‖Fo|-|Fc‖/∑|Fo|, wR2=[∑w(Fo2-Fc2)2/∑w(Fo2)2]1/2.
Table 2.
Selected bond lengths (nm) and angles (°) for H2L and the complex
H2L C (7)-N (1) 0.127 6(4) N (1)-N (2) 0.136 9(3) N (2)-C (8) 0.134 9(4) C (8)-0(2) 0.122 8(3) The complex C (7)-N (1) 0.128 7(3) N (1)-N (2) 0.138 6(3) N (2)-C (8) 0.130 0(3) C (8)-0(2) 0.131 0(3) V (1)-0(1) 0.186 59(17) V (1)-0(2) 0.193 71(16) V (1)-0(5) 0.187 75(17) V (1)-0(6) 0.226 59(19) V (1)-0(8) 0.158 06(19) V (1)-N (1) 0.208 7(2) 0(8)-V (1)-0(1) 99.51(9) 0(8)-V (1)-0(5) 97.00(9) 0(1)-V (1)-0(5) 107.11(7) 0(8)-V (1)-0(2) 101.95(9) 0(1)-V (1)-0(2) 150.55(8) 0(5)-V (1)-0(2) 90.08(7) 0(8)-V (1)-N (1) 95.20(9) 0(1)-V (1)-N (1) 83.70(7) 0(5)-V (1)-N (1) 162.05(8) 0(2)-V (1)-N (1) 74.51(7) 0(8)-V (1)-0(6) 173.49(8) 0(1)-V (1)-0(6) 80.62(7) 0(5)-V (1)-0(6) 76.81(7) 0(2)-V (1)-0(6) 80.32(7) N (1)-V (1)-0(6) 91.29(7) CCDC: 1437202, H2L; 1437201, the complex.
1.5 Cell culture and viable cell counts
The biological assay was determined according to the literature method[14]. In general, C2C12 mouse skeletal muscle cells were cultured in Dulbecco modified Eagle′s medium with 4 mmol·L-1 L-gluta-mine adjusted to contain 1.5 g·L-1 Na2CO3, 4.5 g·L-1 glucose, and 10% fetal bovine serum in a humidified atmosphere of 5% CO2 and 95% air at 37 ℃. C2C12 cells were sub-cultured in log phase to 70% confluence and seeded at a density of 5000 cells per well into 96-well culture plates. To limit batch-to-batch variation, cell subcultures were limited to 10 passages. After three days culture myotube formation was induced by replacing the fetal bovine serum in the medium with 10% horse serum. All experiments were done in five days when more than 75% of the cells were differentiated morphologically. The cells were suspended in a trypan blue (0.1% w/w) phosphate buffered saline solution and the ratio of stained to nonstained cells was determined after 5 min of incubation time. Viable cell counts were performed using a hemocytometer.
1.6 Glucose uptake determination
Three hours prior to glucose uptake, cells were incubated in glucose and serum-free media. On the 5th day, the medium was removed and replaced with 50 mL modified Dulbecco modified Eagle′s medium without phenol red, supplemented with 8.0 mmol·L-1 glucose and 0.1% bovine serum albumin containing either the complex at concentration of 0.10 g·L-1 or the positive control, insulin, or metformin, at 1.0 mmol·L-1 were added to the 96-well plate. The plate was then incubated for 2 h at 37 ℃ and 5% CO2. After incubation, 4.0 mL media was removed from each well and transferred to a new 96-well plate to which 196 mL deionized water was added in each well. A total of 50 mL of this diluted medium was transferred to a new 96-well plate and 50 mL of the prepared glucose assay reagent was added per well and incubated for 30 min at 37 ℃. Absorbance was taken at 570 nm on a 96-well plate reader. The glucose concentration per well was calculated from a standard curve. Glucose utilization was determined by subtracting the glucose concentration left in the medium of the relevant wells following incubation to media not exposed to cells during incubation. All assays were performed in triplicate to minimize the error.
1.7 Cytotoxicity assay
MTT (3-((4, 5-Dimethylthiazo)-2-yl)-2, 5-diphenyl-tetrazolium bromide) was dissolved in phosphate-buffered saline without phenol red at a concentration of 2.0 g·L-1. Dulbecco modified Eagle′s medium in the 96-well plate was refreshed with 200 mL of fresh media followed by addition of 50 mL of MTT solution to each well. The plate was wrapped in aluminium foil to prevent light and incubated at 37 ℃ for 4 h, after which the media with MTT was removed and replaced with 200 mL DMSO and 25 mL Sorensen′s glycine buffer. Absorbance was read at 570 nm in a plate reader.
2 Results and discussion
2.1 Chemistry
The aroylhydrazone compound H2L was readily prepared by the condensation reaction of 3-bromo-5-chlorosalicylaldehyde with 3-hydroxyl-4-methoxybenzohydrazide in methanol. Facile reaction of VO (acac)2 with H2L and maltol in methanol afforded the oxovanadium (Ⅴ) complex. Crystals of H2L and the complex are stable in open air at room temperature. Elemental analyses are in good agreement with the chemical formulae proposed for the compounds.
2.2 Structure description of H2L
Fig. 1 gives perspective view of H2L together with the atomic labeling system. The molecule of the compound adopts E configuration with respect to the methylidene unit. The distance of the C (7)-N (1) meth-ylidene bond (0.127 6(4) nm) confirms it as a typical double bond. The shorter distance of the C (8)-N (2) bond (0.134 9(4) nm) and the longer distance of the C (8)-O (2) bond (0.122 8(3) nm) for the-C (O)-NH-unit than usual, suggest the presence of conjugation effect in the molecule. The bond lengths in the compound are within normal values[20, 24]. The dihedral angle between the two benzene rings is 34.0(5)°. The crystal structure of the compound is stabilized by intermolecular hydrogen bonds, to form two-dimensional sheets along the bc plane (Table 3, Fig. 2).
 Figure 1.
Molecular structure of H2L
Table 3.
Hydrogen bond distances (nm) and bond angles (°) for H2L and the complex
Figure 1.
Molecular structure of H2L
Table 3.
Hydrogen bond distances (nm) and bond angles (°) for H2L and the complex
D-H…A d(D-H) d(H…A) d(D…A) ∠D-H…A H2L 0(1)-H (1)…N (l) 0.082 0.188 0.259 7(3) 145 0(3)-H (3)…0(2)ⅰ 0.082 0.185 0.266 3(3) 171 N (2)-H (2)…0(5)ⅱ 0.090(1) 0.202(2) 0.289 6(3) 166(4) The complex 0(3)-H (3)…0(9)ⅲ 0.082 0.184 0.264 9(3) 168 0(9)-H (9)…0(4)ⅳ 0.082 0.212 0.291 7(3) 165 0(9)-H (9)…0(3)ⅳ 0.082 0.235 0.288 0(3) 123 Symmetry codes: ⅰx, 3/2-y, 1/2+z; ⅱ-x, 1-y, 1-z; ⅲx, y, 1+z; ⅳ2-x, 1-y, 1-z.  Figure 2.
Crystal packing of the complex viewed along the b axis
Figure 2.
Crystal packing of the complex viewed along the b axis
2.3 Structure description of the complex
Fig. 3 gives perspective view of the complex together with the atomic labeling system. The asym-metric unit of the compound contains a mononuclear vanadium complex and a methanol molecule of crystallization. The V atom in the complex is in an octahedral coordination, with the phenolate O, imino N, and enolate O atoms of L, and the hydroxy O atom of the maltolate ligand defining the equatorial plane, and with one oxo O and the carbonyl O atom of the maltolate ligand locating at the axial positions. The V atom deviates from the least-squares plane defined by the equatorial atoms by 0.028 0(1) nm. The coordinate bond lengths in the complex are similar to those observed in vanadium complexes with aroylhydrazone ligands[25-27]. Distortion of the octahedral coordination can be observed from the coordinate bond angles, ranging from 74.51(7)° to 107.11(7)° for the perpen-dicular angles, and from 150.55(8)° to 173.49(8)° for the diagonal angles. The dihedral angle between the two benzene rings of the aroylhydrazone ligand is 14.8(3)°. During coordination, the C (7)-N (1), N (1)-N (2) and C (8)-O (2) bonds of the complex are longer than those of the free aroylhydrazone, while the N (2)-C (8) bond of the complex is shorter than that of the free aroylhydrazone. The crystal structure of the compound is stabilized by intermolecular hydrogen bonds, to form two-dimensional sheets along the ab plane (Table 3, Fig. 4).
 Figure 3.
Molecular structure of the complex
Figure 3.
Molecular structure of the complex
 Figure 4.
Crystal packing of the complex, viewed along the a axis
Figure 4.
Crystal packing of the complex, viewed along the a axis
2.4 IR and electronic spectra
The medium and broad absorption centered at 3 429 cm-1 in the spectrum of H2L and 3 456 cm-1 in the spectrum of the complex substantiates the presence of phenol groups. The sharp band indicative of the N-H vibration of H2L is located at 3 206 cm-1, and the intense band indicative of the C=O vibration is located at 1 641 cm-1 in the spectrum of H2L, which are absence in the complex, indicating the enolisation of the amide functionality and subsequent proton replacement by the V atom. The strong absorption bands at 1 605 cm-1 for H2L and 1619 cm-1 for the complex are assigned to the azomethine ν(C=N)[28]. The typical absorption at 974 cm-1 of the complex can be assigned to the V=O vibration[29].
Electronic spectra of H2L and the complex were recorded with 10-5 mol·L-1 in methanol and acetonitrile, respectively, in the range of 200~600 nm. In the UV-Vis region the complex show band centered at 352 nm and weak band at 437 nm. The weak band is attributed to intramolecular charge transfer transitions from the pπ orbital on the nitrogen and oxygen to the empty d orbitals of the metal[30]. The intense bands observed at 280 nm for the complex and 295 nm for H2L are assigned to intraligand π-π* transitions[30].
2.5 Thermal stability
Thermal gravimetric analysis was conducted to examine the stability of the complex (Fig. 5). The first step started at 130 ℃ and completed at 163 ℃, which corresponds to the loss of the methanol molecule. The observed weight loss of 5.1% is in accordance with the calculated value. The second step, from 163 to 345 ℃, corresponds to the loss of the maltolate ligand except for one O atom. The observed weight loss of 17.4% is in accordance with the calculated value (17.5%). The third step, at 345 ℃, corresponds to the loss of aroylhydrazone ligand except for the O1, O2, N1, N2 and C8 atoms. The observed weight loss of 52.0% is in accordance with the calculated value (52.5%). The last step, from 345 to 454 ℃, corresponds to the loss of the remaining part of the ligands, and formation of V2O5. The total observed weight loss of 86.3% is in accordance with the calculated value of 85.4%.
 Figure 5.
TG curve of the complex
Figure 5.
TG curve of the complex
2.6 Glucose uptake in the presence of the complex
Glucose level is a key diagnostic parameter for many metabolic disorders. Biovision glucose assay kit provides direct measurement of glucose in various biological samples. The glucose enzyme mix specifically oxidizes glucose to generate a product, which reacts with a dye to generate color. The generated color is proportional to the glucose amount. The method is rapid, simple, sensitive, and suitable for high throughput[14]. The insulin-like activity of vanadium compounds is usually related to their ability to lower the blood glucose level by activating the glucose transport into the cell of the peripheral tissues. In this study, we have investigated the in vitro glucose uptake by C2C12 muscle cells following exposure to the complex. The results are given in Table 4.
Table 4.
Glucose uptake in C2C12 cell line results*
% Compound Glucose utilization DMSO 100 The complex 136±8 Insulin 141±15 Metformin 146±13 * Results show the uptake of glucose from the culture media containing 8.0 mmol·L-1 glucose by C2C12 cells over one 1 h; C2C12 cells were pre-exposed to the compounds, in glucose and serum-free media for 3 h before the glucose uptake experiments; Basal glucose uptake for solvent vehicle only (DMSO) is represented as 100% and the subsequent increase or decrease induced by the compounds is reflected as ±100%. Insulin-mimetic test on C2C12 muscle cells indicates that the complex significantly stimulated cell glucose utilization with cytotoxicity at 0.07 g·L-1. In general, the insulin enhancing activity of the complex is similar to the reference drugs Insulin and Metformin. So, it is a promising vanadium-based insulin-like material.
-
-
[1]
Pillai S I, Subramanian S P, Kandaswamy M. Eur. J. Med. Chem., 2013, 63:109-117 doi: 10.1016/j.ejmech.2013.02.002
-
[2]
Smee J J, Epps J A, Ooms K, et al. J. Inorg. Biochem., 2009, 103:575-584 doi: 10.1016/j.jinorgbio.2008.12.015
-
[3]
Sanna D, Micera G, Garribba E. Inorg. Chem., 2013, 52: 11975-11985 doi: 10.1021/ic401716x
-
[4]
He L, Wang X S, Zhao C, et al. Metallomics, 2014, 6:1087-1096 doi: 10.1039/c4mt00021h
-
[5]
Crans D C, Trujillo A M, Pharazyn P S, et al. Coord. Chem. Rev., 2011, 255:2178-2192 doi: 10.1016/j.ccr.2011.01.032
-
[6]
Sheela A, Roopan S M, Vijayaraghavan R. Eur. J. Med. Chem., 2008, 43:2206-2210 doi: 10.1016/j.ejmech.2008.01.002
-
[7]
Zhang Y, Yang X D, Wang K, et al. J. Inorg. Biochem., 2006, 100:80-87 doi: 10.1016/j.jinorgbio.2005.10.006
-
[8]
Dornyei A, Marcao S, Pessoa J C, et al. Eur. J. Inorg. Chem., 2006, 18:3614-3621
-
[9]
Haratake M, Fukunaga M, Ono M, et al. J. Biol. Inorg. Chem., 2005, 10:250-258 doi: 10.1007/s00775-005-0634-8
-
[10]
McNeill J H, Yuen V G, Hoveyda H R, et al. J. Med. Chem., 1992, 35:1489-1491 doi: 10.1021/jm00086a020
-
[11]
Yuen V G, Orvig C, McNeill J H. Can. J. Physiol. Pharmacol., 1993, 71:263-269 doi: 10.1139/y93-041
-
[12]
Yuen V G, Orvig C, Thompson K H, et al. Can. J. Physiol. Pharmacol., 1993, 71:270-276 doi: 10.1139/y93-042
-
[13]
Fujimoto S, Fujii K, Yasui H. J. Clin. Biochem. Nutr., 1997, 23:113-129 doi: 10.3164/jcbn.23.113
-
[14]
Nejo A A, Kolawole G A, Opoku A R, et al. J. Coord. Chem., 2009, 62:3411-3424 doi: 10.1080/00958970903104327
-
[15]
Xie M J, Yang X D, Liu W P, et al. J. Inorg. Biochem., 2010, 104:851-857 doi: 10.1016/j.jinorgbio.2010.03.018
-
[16]
Amir M, Ali I, Hassan M Z, et al. Arch. Pharm., 2014, 347: 958-968 doi: 10.1002/ardp.v347.12
-
[17]
Rajitha G, Prasad K V S R G, Umamaheswari A, et al. Med. Chem. Res., 2014, 23:5204-5214 doi: 10.1007/s00044-014-1091-0
-
[18]
El-Sayed M A A, Abdel-Aziz N I, Abdel-Aziz A A M, et al. Bioorg. Med. Chem., 2011, 19:3416-3424 doi: 10.1016/j.bmc.2011.04.027
-
[19]
Horiuchi T, Chiba J, Uoto K, et al. Bioorg. Med. Chem. Lett., 2009, 19:305-308 doi: 10.1016/j.bmcl.2008.11.090
-
[20]
Zhang M, Xian D M, Li H H, et al. Aust. J. Chem., 2012, 65:343-350
-
[21]
SMART and SAINT, Bruker AXS Inc., Madison, 2002.
-
[22]
Sheldrick G M. SADABS, University of Göttingen, Germany, 1996.
-
[23]
Sheldrick G M. Acta Crystallogr., 2008, A64:112-122
-
[24]
Dinda R, Sengupta P, Ghosh S, et al. J. Chem. Soc. Dalton Trans., 2002:4434-4439
-
[25]
任晋琦, 焦庆祝, 王艺诺, .无机化学学报, 2014, 30(3):640-648 http://www.wjhxxb.cn/wjhxxbcn/ch/reader/view_abstract.aspx?file_no=20140327&flag=1REN Jin-Qi, JIAO Qing-Zhu, WANG Yi-Nuo, et al. Chinese J. Inorg. Chem., 2014, 30(3):640-648 http://www.wjhxxb.cn/wjhxxbcn/ch/reader/view_abstract.aspx?file_no=20140327&flag=1
-
[26]
赵月, 韩笑, 周晓霞, .无机化学学报, 2013, 29 (4):867-874 http://www.wjhxxb.cn/wjhxxbcn/ch/reader/view_abstract.aspx?file_no=20130433&flag=1ZHAO Yue, HAN Xiao, ZHOU Xiao-Xia, et al. Chinese J. Inorg. Chem., 2013, 29 (4):867-874 http://www.wjhxxb.cn/wjhxxbcn/ch/reader/view_abstract.aspx?file_no=20130433&flag=1
-
[27]
贺淼, 焦庆祝, 陈相飞, .无机化学学报, 2015, 31(8):1590-1596 http://www.wjhxxb.cn/wjhxxbcn/ch/reader/view_abstract.aspx?file_no=20150818&flag=1HE Miao, JIAO Qing-Zhu, CHEN Xiang-Fei, et al. Chinese J. Inorg. Chem., 2015, 31(8):1590-1596 http://www.wjhxxb.cn/wjhxxbcn/ch/reader/view_abstract.aspx?file_no=20150818&flag=1
-
[28]
You Z L, Xian D M, Zhang M. CrystEngComm, 2012, 14: 7133-7136 doi: 10.1039/c2ce26201k
-
[29]
Sangeetha N R, Kavita V, Wocadlo S. J. Coord. Chem., 2000, 51:55-66 doi: 10.1080/00958970008047078
-
[30]
Asgedom G, Sreedhara A, Kivikoski J, et al. J. Chem. Soc., Dalton Trans., 1996, 1:93-97
-
[1]
-

Figure 1 Molecular structure of H2L
Displacement ellipsoids are drawn at the 30% probability level and H atoms are shown as small spheres of arbitrary radii

Figure 2 Crystal packing of the complex viewed along the b axis
Hydrogen bonds are shown as dashed lines

Figure 3 Molecular structure of the complex
Displacement ellipsoids are drawn at the 30% probability level and H atoms are shown as small spheres of arbitrary radii

Figure 4 Crystal packing of the complex, viewed along the a axis
Hydrogen bonds are shown as dashed lines
Table 1. Crystallographical and experimental data for H2L and the complex
H2L The complex Formula C15H12BrClN2O4 C22H19BrClN2O9V Formula weight 399.63 621.69 Crystal system Monoclinic Triclinic Space group P21/c P1 a/nm 1.799 2(2) 0.801 83(5) b/nm 0.727 23(6) 1.280 37(8) c/nm 1.222 0(1) 1.301 01(8) α/(°) 90 103.909(1) β/(°) 97.287(2) 92.437(1) γ/(°) 90 106.885(1) V/nm3 1.586 0(2) 1.231 5(1) Z 4 2 Dc/(g·cm-3) 1.674 1.677 μ/mm-1 2.781 2.188 F(000) 800 624 θrange/(°) 3.02-25.03 1.72-25.50 Index range (h, k, l) -19~21=-8~8=-14~14 -9~9,-14~15=-12~15 Measured reflections 2 805 4 552 Observed reflections [I≥2σ(I)] 1 934 3 531 Absorption correction Multi-scan Multi-scan Min. and max. transmission 0.489 2 and 0.531 7 0.633 0 and 0.694 1 Data, restraints, parameters 2 805, 1, 214 4 552, 0, 330 Goodness-of-fit on F2 1.032 1.017 R1, wR2(I≥2σ(I))* 0.039 9, 0.082 2 0.031 3, 0.074 1 R1, wR2(all data)* 0.071 7, 0.094 0 0.047 1, 0.081 5 Largest diff. peak and hole/(e·nm-3) 491 and-467 389 and-326 *R1=∑‖Fo|-|Fc‖/∑|Fo|, wR2=[∑w(Fo2-Fc2)2/∑w(Fo2)2]1/2.  下载: 导出CSV
Table 2. Selected bond lengths (nm) and angles (°) for H2L and the complex
H2L C (7)-N (1) 0.127 6(4) N (1)-N (2) 0.136 9(3) N (2)-C (8) 0.134 9(4) C (8)-0(2) 0.122 8(3) The complex C (7)-N (1) 0.128 7(3) N (1)-N (2) 0.138 6(3) N (2)-C (8) 0.130 0(3) C (8)-0(2) 0.131 0(3) V (1)-0(1) 0.186 59(17) V (1)-0(2) 0.193 71(16) V (1)-0(5) 0.187 75(17) V (1)-0(6) 0.226 59(19) V (1)-0(8) 0.158 06(19) V (1)-N (1) 0.208 7(2) 0(8)-V (1)-0(1) 99.51(9) 0(8)-V (1)-0(5) 97.00(9) 0(1)-V (1)-0(5) 107.11(7) 0(8)-V (1)-0(2) 101.95(9) 0(1)-V (1)-0(2) 150.55(8) 0(5)-V (1)-0(2) 90.08(7) 0(8)-V (1)-N (1) 95.20(9) 0(1)-V (1)-N (1) 83.70(7) 0(5)-V (1)-N (1) 162.05(8) 0(2)-V (1)-N (1) 74.51(7) 0(8)-V (1)-0(6) 173.49(8) 0(1)-V (1)-0(6) 80.62(7) 0(5)-V (1)-0(6) 76.81(7) 0(2)-V (1)-0(6) 80.32(7) N (1)-V (1)-0(6) 91.29(7)
下载: 导出CSV
Table 3. Hydrogen bond distances (nm) and bond angles (°) for H2L and the complex
D-H…A d(D-H) d(H…A) d(D…A) ∠D-H…A H2L 0(1)-H (1)…N (l) 0.082 0.188 0.259 7(3) 145 0(3)-H (3)…0(2)ⅰ 0.082 0.185 0.266 3(3) 171 N (2)-H (2)…0(5)ⅱ 0.090(1) 0.202(2) 0.289 6(3) 166(4) The complex 0(3)-H (3)…0(9)ⅲ 0.082 0.184 0.264 9(3) 168 0(9)-H (9)…0(4)ⅳ 0.082 0.212 0.291 7(3) 165 0(9)-H (9)…0(3)ⅳ 0.082 0.235 0.288 0(3) 123 Symmetry codes: ⅰx, 3/2-y, 1/2+z; ⅱ-x, 1-y, 1-z; ⅲx, y, 1+z; ⅳ2-x, 1-y, 1-z.
下载: 导出CSV
Table 4. Glucose uptake in C2C12 cell line results*
% Compound Glucose utilization DMSO 100 The complex 136±8 Insulin 141±15 Metformin 146±13 * Results show the uptake of glucose from the culture media containing 8.0 mmol·L-1 glucose by C2C12 cells over one 1 h; C2C12 cells were pre-exposed to the compounds, in glucose and serum-free media for 3 h before the glucose uptake experiments; Basal glucose uptake for solvent vehicle only (DMSO) is represented as 100% and the subsequent increase or decrease induced by the compounds is reflected as ±100%.
下载: 导出CSV
-


 扫一扫看文章
计量
- PDF下载量: 0
- 文章访问数: 357
- HTML全文浏览量: 30
 下载:
下载:
