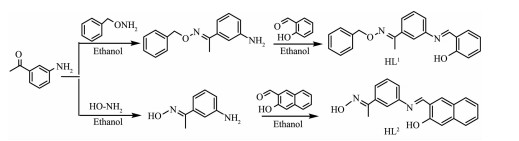
 Scheme 1.
Synthetic routes of HL1 and HL2
Scheme 1.
Synthetic routes of HL1 and HL2
Citation:
SUN Yin-Xia, LI Chun-Yu, YANG Cheng-Juan, ZHAO Ya-Yuan, GUO Jian-Qiang, YU Bin. Two Cu (Ⅱ) Complexes with Schiff Base Ligands: Syntheses, Crystal Structures, Spectroscopic Properties, and Substituent Effect[J]. Chinese Journal of Inorganic Chemistry,
2016, 32(2): 327-335.
doi:
10.11862/CJIC.2016.034

两个Schiff碱铜配合物的合成、晶体结构、光谱性质及取代基效应
摘要:
合成了2个含肟基Schiff碱Cu (Ⅱ) 配合物[Cu (L1)2](1) 和[Cu (L2)2](2)(HL1=1-(3-((2-hydroxybenzylidene) amino) phenyl) ethanone O-benzyl oxime; HL2=1-(3-((2-Hydroxy-naphthalen-1-ylmethylene)-amino)-phenyl)-ethanone oxime),并通过元素分析、红外光谱、紫外光谱,荧光光谱及X射线单晶衍射分析进行了表征和分析。结果表明,配合物1和2具有相似的结构,均由1个中心Cu (Ⅱ) 离子和2个双齿配体单元组成,且Cu (Ⅱ) 离子的配位数为4,具有平面四边形结构。配合物1和2均形成了二维层状超分子结构,不同的是配合物1通过分子间π…π堆积作用相连接,而配合物2通过分子间O-H…N和C-H…π氢键作用而形成了超分子结构。进一步讨论了配合物1的荧光性质及两个配合物间配体的取代基效应。
English
Two Cu (Ⅱ) Complexes with Schiff Base Ligands: Syntheses, Crystal Structures, Spectroscopic Properties, and Substituent Effect
Abstract:
Two new Cu (Ⅱ) complexes [Cu (L1)2](1) (HL1=1-(3-((2-hydroxybenzylidene) amino) phenyl) ethanone O-benzyl oxime) and [Cu (L2)2] (2) (HL2 =1-(3-((2-Hydroxy-naphthalen-1-ylmethylene)-amino)-phenyl)-ethanone oxime) have been synthesized and characterized by elemental analyses, IR spectra, UV-Vis spectra, fluorescence measurement and X-ray single crystal diffraction method. X-ray crystallographic analyses have indicated that complexes 1 and 2 have the similar structure, consisting of one Cu (Ⅱ) ion, two ligand units. In the complexes, the Cu (Ⅱ) ion lying on an inversion centre, is four-coordinated in a trans-CuN2O2 square-planar geometry by two hydroxy O and two imine N atoms from two symmetry-related N, O-bidentate Schiff base ligands. The supramolecular structures of the two complexes 1 and 2 are also similar two-dimensional supramolecular structure linking by different intermolecular interaction. Complex 1 forms an infinite two-dimensional supramolecular structure by two π…π interaction, while that of complex 2 by intermolecular O-H…N and C-H…π hydrogen bond interactions. The fluorescence property of complex 1 and substituent effects of the two complexes are discussed. CCDC: 1003363, 1; 1043506, 2.
-
Key words:
- Cu (Ⅱ) complex
- / crystal structure
- / Schiff base ligand
- / substituent effect
-
0 Introduction
Schiff base compounds have been playing an important part in the development of coordination chemistry because of their potential application in catalysis[1-2], bioscience[3-4], new materials[5], magnetic properties[6-9] and constructing supramolecular structu-res[10-11]. Also, the Schiff base ligands are strong donors and therefore the oxime-containing ligands were found to efficiently stabilize high oxidation states of metal ions like Cu (Ⅱ) and Ni (Ⅱ). The presence of additional donor groups together with the oxime group in the ligand molecule may result in significant increase of chelating efficiency and ability to form polynuclear complexes. Herein, two new Cu (Ⅱ) complexes with the Schiff base ligand, [Cu (L1)2] (1) (HL1=1-(3-((2-hydroxybenzylidene) amino) phenyl) ethanone O-benzyl oxime) and [Cu (L2)2] (2) (HL2=1-(3-((2-Hydroxy-naphthalen-1-ylmethylene)-amino)-phenyl)-ethanone oxime) have been synthesized and characterized by elemental analyses, IR spectra, UV-Vis spectra, fluorescence measurement and X-ray single crystal diffraction. X-ray crystallographic analyses reveal that the structures of the complexes 1 and 2 are very similar. They are both mononuclear structures and all the Cu (Ⅱ) ions are four-coordinated.
1 Experimental
1.1 Materials
3-Aminoacetophenone, O-benzylhydroxylamine, salicylaldehyde and 2-hydroxy naphthaldehyde were purchased from Alfa Aesar and used without further purification. The other reagents and solvent were analytical grade from Tianjin Chemical Reagent Factory.
1.2 Methods
C, H and N analyses were carried out with a GmbH VariuoEL V3.00 automatic elemental analyzer. Elemental analysis for Cu was detected by an IRIS ER/S·WP-1 ICP atomic emission spectrometer. FTIR spectra were recorded on a VERTEX70 FTIR spectrophotometer, with samples prepared as KBr pellet (400~4000 cm-1). UV-Vis absorption spectra were recorded on a Shimadzu UV-2550 spectrometer. X-Ray single crystal structure was determined on a Bruker Smart 1000 CCD area detector. Melting points were measured by the use of a microscopic melting point apparatus made in Beijing Taike Instrument Limited Company and the thermometer was uncorrected.
1.3 Syntheses of HL1 and HL2
HL1 (1-(3-((2-hydroxybenzylidene) amino) phenyl) ethanone O-benzyl oxime) and HL2 (1-(3-((2-Hydroxy-naphthalen-1-ylmethylene)-amino)-phenyl)-ethanone oxime) were synthesized according to the reported method (Scheme 1)[12-13].
Scheme 1.
Synthetic routes of HL1 and HL2
1.4 Synthesis of [Cu (L1)2] (1)
A solution of copper (Ⅱ) acetate monohydrate (1.3 mg, 0.007 mmol) in methanol (4 mL) was added dropwise to a solution of HL1 (1.7 mg, 0.005 mmol) in dichloromethane (5 mL) at room temperature. The mixing solution turned to yellow immediately. Then it was filtered and the filtrate was allowed to stand at room temperature for about one week. Brown red block single crystals which is suitable for X-ray structural determination were obtained. Anal. Calcd. for C44H38CuN4O4 (%): C, 70.43; H, 5.10; N, 7.47; Cu, 8.47. Found (%): C, 70.38; H, 5.17; N, 7.45; Cu, 8.50.
1.5 Synthesis of [Cu (L2)2] (2)
A solution of copper (Ⅱ) acetate monohydrate (2.3 mg, 0.01 mmol) in methanol (3 mL) was added dropwise to a solution of HL2 (1.5 mg, 0.005 mmol) in dichloromethane (5 mL) at room temperature. The color of the mixing solution turned yellow immediately, and it was allowed to stand at room temperature for three weeks. Then the solvent partially evaporated and red-brown prismatic single crystals suitable for X-ray crystallographic analysis were obtained. Anal. Calcd. for C38H30CuN4O4(%): C, 68.10; H, 4.51; N, 8.36; Cu, 9.48. Found (%): C, 67.98; H, 4.57; N, 8.29; Cu, 9.52.
1.6 Crystal structure determination
The single crystals of complexes with approximate dimensions of 0.21×0.11×0.05 mm (1) and 0.18×0.14×0.09 mm (2) were placed on a Bruker Smart 1000 CCD area detector. The diffraction data were collected using a graphite monochromated Mo Kα radiation (λ=0.071 073 nm) at 298(2) K. Empirical absorption correction was applied to the data using SADABS program[14]. The structure was solved by direct methods and refined by full-matrix leastsquares method on F2 using the SHELXTL program[15]. All nonhydrogen atoms were refined anisotropically. All the hydrogen atoms were generated geometrically and refined isotropically using the riding model. Details of the crystal parameters, data collection and refinements for complexes 1 and 2 are summarized in Table 1.
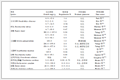 Table 1.
Crystal data and structure refinement for complexes 1 and 2
Table 1.
Crystal data and structure refinement for complexes 1 and 2
Complex 1 2 Empirical formula C44H38CuN4O4 C38H30CuN4O4 Formula weight 750.32 670.21 Crystal system Triclinic Monoclinic Space group P1 C2/c a/nm 0.781 30(6) 2.940 0(4) b/nm 0.939 05(8) 0.584 20(7) c/nm 1.237 2(1) 1.870 0(2) α/(°) 94.549(2) 90 β/(°) 93.738(1) 102.660(2) γ/(°) 91.377(1) 90 V/nm3 0.902 6(1) 3.159 3(4) Z 1 4 Dc/(g.cm3) 1.38 1.409 μ/(mm-1) 0.656 0.74 F(000) 391 1 388 θ range for data collection/(°) 2.61~25.02 1.41~25.10 Limiting indices -7≤h≤9;-9≤k≤11;-14≤l≤13 -35≤h≤33;-6≤k≤6;-22≤l≤22 Reflections collected, unique 4 607, 3 119(Rint=0.073 4) 7 968, 2 805(Rint=0.086 0) Completeness to θ/% 97.8(θ=25.02°) 100%(θ=25.10°) Data, restraints, parameters 3 119, 0, 242 2 085, 0, 216 GOF on F2 1.027 0.965 Final R indices [I > 2σ(I)] R1=0.080 0, wR2=0.175 8 R1=0.057 0, wR2=0.130 1 R indices (all data) R1=0.128 9, WR2=0.196 5 R1=0.107 3, wR2=0.157 4 (△ρ)max, (△ρ)min/(e • nm-3) 521, -526 941, -876 2 Results and discussion
2.1 IR spectra analyses
The FTIR spectra of HL1, HL2 and their corresponding Cu (Ⅱ) complexes 1 and 2 exhibit various bands in the 400~4 000 cm-1 region. The most important FTIR bands for HL1, HL2 and complex 1~2 are given in Table 2. The free ligand HL1 and HL2 exhibit characteristic C=N stretching bands at 1 617 and 1 620 cm-1, while that of complex 1 and complex 2 were observed in the 1 600 cm-1 and 1 602 cm-1, respectively. The C=N stretching frequencies are all shifted to lower frequencies by ca. 17 and 18 cm-1 upon complexation respectively, indicating a decrease in the C=N bond order due to the coordinated bond of the Cu (Ⅱ) atom with the imino nitrogen lone pair[16]. In the 1 445~1 564 cm-1 region, the observed bands were attributed to aromatic C=C vibrations. Upon coordination these bands shift to lower frequencies for the Cu (Ⅱ) complexes[17]. The Ar-O stretching frequency appears as a strong band within the 1 178~1 144 cm-1 as reported for similar ligands[18]. This band occurs at 1 178 cm-1 for the ligand HL1, and at 1 144 cm-1 for complex 1, the band occurs at 1 182 cm-1 for the ligand HL2, and at 1 137 cm-1 for complex 2. The Ar-O stretching frequency is shifted to a lower frequency, indicating that the Cu-O bond was formed between the Cu (Ⅱ) ion and phenolic oxygen atom of phenolic hydroxyl group[13]. The far-infrared spectra of complexes 1 and 2 was also obtained in the region 500~100 cm-1 in order to identify frequencies due to the Cu-O and Cu-N bonds. The FTIR spectrum of complex 1 showed ν(Cu-N) and ν(Cu-O) vibration absorption frequencies at 540 cm-1 and 503 cm-1 (or 519 and 463 cm-1 for complex 2), respectively. These assignments are consistent with the literature frequency values[19].
Table 2.
Main bands in IR spectra of the ligand HL1, HL2 and their Cu (Ⅱ) complexes
cm-1 ν(C=N) ν(Ar-0) ν(Cu-N) ν(Cu-0) ν(C=C) benzene ring skeleton HL1 1 617 1 178 - - 1 564 1 490 1 452 Complex 1 1 600 1 144 540 503 1 531 1 500 1 445 HL2 1 620 1 182 - - 1 589 1 543 1 483 Complex 2 1 602 1 137 519 463 1 548 1 526 1 456 2.2 UV-Vis absorption spectra analyses
The absorption spectra of ligand HL1 and its corresponding Cu (Ⅱ) complex 1 were determined in diluted CH2Cl2 solution, and ligand HL2 and its corresponding Cu (Ⅱ) complex 2 were determined in diluted DMF solution as shown in Fig. 1 and Fig. 2.
 Figure 1.
UV-Vis absorption spectra of HL1 and the complex 1 in diluted CH2Cl2 solution at room temperature (c=5×10⁻⁵ mol·L-1)
Figure 1.
UV-Vis absorption spectra of HL1 and the complex 1 in diluted CH2Cl2 solution at room temperature (c=5×10⁻⁵ mol·L-1)
 Figure 2.
UV-Vis absorption spectra of HL2 and the complex 2 in diluted DMF solution at room temperature (c=5×10⁻⁵ mol·L-1)
Figure 2.
UV-Vis absorption spectra of HL2 and the complex 2 in diluted DMF solution at room temperature (c=5×10⁻⁵ mol·L-1)
UV-Vis spectrum of the free ligand HL1 exhibits three absorption peaks at ca. 224, 262 and 347 nm (Fig. 1). The absorption peak of HL1 at 224 nm assigned to the π-π* transition of the benzene rings shifts to low energy region by ca. 7 nm in complex 1, indicating Cu (Ⅱ) ion coordinated with the O and N atoms of ligand units. The absorption peak of HL1 at 262 nm attributed to the intra-ligand π-π* transition of the C=N bonds is shifted to 269 nm in complex 1 upon complexation. The absorption peak of HL1 at 347 nm is absent in complex 1, however, a new absorption peak is observed at 388 nm assigned to an L→M charge-transfer transition which is characteristic of a transition metal complex with N2O2 coordination sphere[20]. It can be seen that the absorption peaks of complex 2 are obviously different from those of the HL1 upon complexation (Fig. 2). Compared with complex 2, an important feature of the absorption spectrum of HL2 is shown that three absorption peaks are observed at 243, 382 and 437 nm, which are absent in the spectrum of complex 2. The other feature is that the absorption peak at 267 and 320 nm in HL2 is shifted to 269 and 311 nm in complex 2, respectively, indicating that the coordination of Cu (Ⅱ) atom with HL2.
2.3 Fluorescence spectra
The emission spectrum of the complex 1 in diluted CH2Cl2 solution at room temperature is shown in Fig. 3. An intense excitation peak is observed at 311 nm. The bluish violet emission for complex 1 can be observed, where the maximum emission wavelength was at 430 nm. The Stokes shift between the maximum wavelength of the fluorescence emission and the fluorescence excitation is 119 nm. This red-shift might be related to the coordination of the Cu (Ⅱ) atom to the ligand and increase of the rigidity of the ligands, which can diminish the loss of energy via vibrational motions and increase the emission efficiency.
 Figure 3.
Emission spectrum of the complex 1 in diluted CH2Cl2 at room temperature
Figure 3.
Emission spectrum of the complex 1 in diluted CH2Cl2 at room temperature
2.4 Structural Description of the complexes 1 and 2
The single crystal structures of complexes 1 and 2 were confirmed by X-ray crystallography (Fig. 4 and 5). The selected bond lengths and angles of complexes 1 and 2 are listed in Table 3. The complex 1 crystallizes in the triclinic system and P1 space group, whereas the complex 2 crystallizes in the monoclinic system and C2/c space group. Both of the complexes can be described as centrosymmetric mononuclear Cu (Ⅱ) complexes. The Cu (Ⅱ) ion lying on the inversion centre, is four-coordinated in a trans-CuN2O2 square-planar geometry, with two phenolic O and two imino N atoms from two N, O-bidentate oxime-type ligands (HL1 and HL2).
 Figure 4.
Molecular structure of complex 1 showing 30% probability displacement ellipsoids
Figure 4.
Molecular structure of complex 1 showing 30% probability displacement ellipsoids
 Figure 5.
Molecular structure of complex 2 showing 30% probability displacement ellipsoids
Table 3.
Selected bond lengths (nm) and bond angles (°) for complexes 1 and 2
Figure 5.
Molecular structure of complex 2 showing 30% probability displacement ellipsoids
Table 3.
Selected bond lengths (nm) and bond angles (°) for complexes 1 and 2
1 Cul-02a 0.l88 8(4) Cul-02 0.l88 8(4) Cul-N2a 0.200 0(4) Cul-N2 0.200 0(4) 02a-Cul-02 l80.00(l) 02-Cul-N2a 88.35(2) N2a-Cul-N2 l80.00(2) C5-N2-Cul l2l.8(4) 02a-Cul-N2a 9l.65(2) 02a-Cul-N2 88.35(2) C9-N2-Cul l2l.5(3) Cll-02-Cul l27.0(4) 2 Cul-0lb 0.l88 5(3) Cul-0l 0.l88 5(3) Cul-Nlb 0.20l 4(3) Cul-Nl 0.20l 4(3) 0l-Cul-0lb l80.00(9) 0l-Cul-Nlb 89.6l (l) Nlb-Cul-Nl l79.99(2) Cl2-N2-Cul l20.7(3) 0lb-Cul-Nlb 90.39(l) 0lb-Cul-Nl 89.6l (l) Cll-N2-Cul l23.l (3) C7-0l-Cul l30.5(3) Symmetry codes: a: 1-x, 1-y, 1-z for 1;b:-x, -y+1, -z+2 for 2 As shown in Fig. 6, complex 1 is stabilized by the πcentroid (C10-C15)-πcentroid (C10-C15) stacking interactions of benzene rings linking the neighboring molecules into a 1D infinite chain parallel to the a axis (Table 4). In addition, this adjacent chains along a axis are further held together by the other intermolecular πcentroid (C17-C22)-πcentroid (C17-C22) stacking interactions (Fig. 7) to form 2D supramolecular structure parallel to the ac planes (Fig. 8). Whereas in complex 2, as illustrated in Fig. 9, each oxime nitrogen atom N2 of the two ligand molecules is hydrogen-bonded to the-O2H2A group of the oxime group from the other neighboring molecule, which resulted in the formation of a classical six-member ring and a 1D infinite chain synchronously. Furthermore, this linkage is further stabilized by four C17-H17…π(Cg3) interactions to form the 2D infinite supramolecular planar (Fig. 10 and Table 5).
 Figure 6.
View of the 1D single chain motif within complex 1 along the a axis
Table 4.
Putative π-π stacking interactions for complex 1
Figure 6.
View of the 1D single chain motif within complex 1 along the a axis
Table 4.
Putative π-π stacking interactions for complex 1
Ring (I) Ring (J) d (Cg-Cg)/nm d (Cg (I)-perp)/nm d (Cg (J)-perp)/nm Slippage/nm Cgl* Cg1 0.406 6(4) 0.353 8(3) 0.353 7(3) 0.200 5 Cg2* Cg2 0.387 2(4) 0.357 3(3) 0.357 3(3) 0.l49 2 *Cgl and Cg2 are the centroids of benzene ring Cl0-Cl5 and Cl7-C22 of complex 1, respectively  Figure 7.
View of the 1D single chain motif within complex 1 along the c axis
Figure 7.
View of the 1D single chain motif within complex 1 along the c axis
 Figure 8.
Part of 2D supramolecular structure of the complex 1 showing the formation the two π…π stacking interaction
Figure 8.
Part of 2D supramolecular structure of the complex 1 showing the formation the two π…π stacking interaction
 Figure 9.
View of a 1D single chain motif containing hydrogen bonds for complex 2
Figure 9.
View of a 1D single chain motif containing hydrogen bonds for complex 2
 Figure 10.
Part of 2D supramolecular structure of the complex 2 showing the formation of C17-H17…Cg3 and O2-H2A…N2 hydrogen bond
Table 5.
Hydrogen-bonding for complex 2
Figure 10.
Part of 2D supramolecular structure of the complex 2 showing the formation of C17-H17…Cg3 and O2-H2A…N2 hydrogen bond
Table 5.
Hydrogen-bonding for complex 2
D-H…A d (D-H)/nm d (H…A)/nm d (D…A)/nm ∠DHA/(°) Symmetry code 02-H2A…N2 0.082 0 0.208 0.278 9 (6) l45 l/2-x, 3/2-y, 2-z Cl7-Hl7…Cg3* 0.093 0 0.295 0.379 8(4) l53 x, l+y, z *Cg3 is the centroid of benzene ring Cl-C5-Cl0 of complex 2 2.5 Substituent effects
The overall structures of the two complexes are found to be identical except that the oxime portion and aromatic ring differs in the ligands. The bond lengths of complex 1 are different from those of complex 2 due to the different substituent group in the bidentate ligands. In both bases, two imino nitrogen and two phenolic oxygen atoms form the square base with the Cu-N bonds being slightly longer than the corresponding Cu-O bonds. The elongation of the Cu-N bonds probably due to the weaker coordina-tion ability of the nitrogen atom than that of phenolic oxygen atom. Similar elongation has been observed in Cu (Ⅱ) complexes with Schiff base ligands[21-22]. However, the coordination bond Cu-N (0.200 0 nm) of complex 1 is shorter than the Cu-N (0.201 4 nm) of complex 2, but Cu-O (0.188 8 nm) of complex 1 is almost equal to the Cu-O (0.188 5 nm) of complex 2. Meanwhile, the angle of N2-Cu1-O2 (88.35°) in complex 1 is smaller with the angle of N1-Cu1-O1 (89.61°) in complex 2. In addition, the supramolecular structures of the two complexes 1 and 2 are also similar two-dimensional supramolecular structure linking by different intermolecular interaction, in which complex 1 is stabilized by two π…π interaction, while that of complex 2 by intermolecular O-H…N and C-H…π hydrogen bond interactions. The substituent effects also give rise to the variations in IR and UV-Vis spectra in complexes 1 and 2.
3 Conclusions
According to the data and discussion above, two Schiff base mononuclear Cu (Ⅱ) complexes 1 and 2 have been synthesized and characterized structurally. The Cu (Ⅱ) complexes are tetra-coordinated by two nitrogen atoms and two oxygen atoms of two deprotonated L-units defining the N2O2 basal plane. The coordination environment around Cu (Ⅱ) atom is best regarded as the square-planar geometry. Complexes 1 and 2 also formed a 2D-layer supramolecular structure by different intermolecular interaction, π…π interaction and O-H…N, C-H…π hydrogen bond interactions, respectively. Consequently, the intermolecular non-classical hydrogen-bonding plays a very important role in the construction of supramolecular networks structure. Furthermore, the substituted groups on the ligands could play a small impact on the coordination geometries and supramolecular structure of complexes 1 and 2.
-
-
[1]
Pini D, Mandoli A, Orlandi S, et al. Tetrahedron: Asymmetry, 1999, 10(20):3883-3886 doi: 10.1016/S0957-4166(99)00426-7
-
[2]
Yang H Q, Zhang L, Zhong L, et al. Angew. Chem. Int. Ed., 2007, 46(36):6861-6865 doi: 10.1002/(ISSN)1521-3773
-
[3]
Brewer C, Brewer G, Scheidt W R, et al. Inorg. Chim. Acta., 2001, 313(1):65-70
-
[4]
Brayshaw P A, Bünzli J-C G, Froidevaux P, et al. Inorg. Chem., 1995, 34:2068-2076 doi: 10.1021/ic00112a019
-
[5]
Miyasaka H, Matsumoto N, Okawa H, et al. J. Am. Chem. Soc., 1996, 118(5):981-994 doi: 10.1021/ja952706c
-
[6]
Bencini A, Benelli C, Caneschi A, et al. J. Am. Chem. Soc., 1985, 107(26):8128-8136 doi: 10.1021/ja00312a054
-
[7]
Sasaki M, Manseki K, Horiuchi H, et al. J. Chem. Soc. Dalton Trans., 2000, 3:259-263
-
[8]
Edder C, Piguet C, Bünzli J-C G, et al. Chem. Eur. J., 2001, 7(14):3014-3024 doi: 10.1002/(ISSN)1521-3765
-
[9]
Bünzli J C G, Piguet C. Chem. Rev., 2002, 102(6):1897-1928 doi: 10.1021/cr010299j
-
[10]
Kohawole G A, Patel K S J. Chem. Soc., Dalton Trans., 1981, 1241-1245
-
[11]
Sun Y X, Wang L, Dong X Y, et al. Synth. React. Inorg. Met.-Org. Nano-Met. Chem., 2013, 43(5):599-603 doi: 10.1080/15533174.2012.751424
-
[12]
Sun Y X, Xu L, Zhao T H, et al. Synth. React. Inorg. Met-Org. Nano-Met. Chem., 2013, 43(4):509-513 doi: 10.1080/15533174.2012.740756
-
[13]
董文魁, 唐晓璐, 何雪妮, .无机化学学报, 2009, 25(3):528-532 http://www.wjhxxb.cn/wjhxxbcn/ch/reader/view_abstract.aspx?file_no=20090328&flag=1DONG Wen-Kui, TANG Xiao-Lu, HE Xue-Ni, et al. Chinese. J. Inorg. Chem., 2009, 25(3):528-532 http://www.wjhxxb.cn/wjhxxbcn/ch/reader/view_abstract.aspx?file_no=20090328&flag=1
-
[14]
Sheldrick G M. SADABS, University of Göttingen, Germany, 1996.
-
[15]
Sheldrick G M. SHELXS 97, Program for Refinement of Crystal Structures, University of Göttingen, Germany, 1997.
-
[16]
Asadi M, Jamshid K A, Kyanfar A H. Inorg. Chim. Acta, 2007, 360:1725-1730 doi: 10.1016/j.ica.2006.09.013
-
[17]
Tümer M, Koksal H, Sener M K, et al. Transition Met. Chem., 1999, 24(4):414-420 doi: 10.1023/A:1006973823926
-
[18]
Majumder A, Rosair G M, Mallick A, et al. Polyhedron, 2006, 25:1753-1762 doi: 10.1016/j.poly.2005.11.029
-
[19]
Akine S, Taniguchi T, Nabeshima T. Inorg. Chem., 2004, 43: 6142-6144 doi: 10.1021/ic049282k
-
[20]
Gomes L, Pereira E, Castro D B. J. Chem. Soc. Dalton Trans., 2000, 8:1373-1379
-
[21]
Dong W K, He X N, Yan H B, et al. Polyhedron, 2009, 28: 1419-1428 doi: 10.1016/j.poly.2009.03.017
-
[22]
Nathan L C, Koehne J E, Gilmore J M, et al. Polyhedron, 2003, 22(6):887-894 doi: 10.1016/S0277-5387(03)00029-9
-
[1]
-

Figure 1 UV-Vis absorption spectra of HL1 and the complex 1 in diluted CH2Cl2 solution at room temperature (c=5×10⁻⁵ mol·L-1)

Figure 2 UV-Vis absorption spectra of HL2 and the complex 2 in diluted DMF solution at room temperature (c=5×10⁻⁵ mol·L-1)

Figure 3 Emission spectrum of the complex 1 in diluted CH2Cl2 at room temperature
c=5.00×10⁻⁵ mol·L-1, λex=311 nm, λem=430 nm

Figure 4 Molecular structure of complex 1 showing 30% probability displacement ellipsoids
Symmetry code: a: 1-x, 1-y, 1-z

Figure 5 Molecular structure of complex 2 showing 30% probability displacement ellipsoids
Symmetry code: a:-x, 1-y, 2-z

Figure 6 View of the 1D single chain motif within complex 1 along the a axis
Hydrogen atoms are omitted for clarity; Symmetry code: a: 2-x, 1-y, 1-z

Figure 7 View of the 1D single chain motif within complex 1 along the c axis
Symmetry code: a: 3-x, 1-y, 2-z

Figure 8 Part of 2D supramolecular structure of the complex 1 showing the formation the two π…π stacking interaction

Figure 9 View of a 1D single chain motif containing hydrogen bonds for complex 2
Hydrogen atoms, except those forming hydrogen bonds, are omitted for clarity; Symmetry code: a: 1/2-x, 3/2-y, 2-z

Figure 10 Part of 2D supramolecular structure of the complex 2 showing the formation of C17-H17…Cg3 and O2-H2A…N2 hydrogen bond
Symmetry code: a: 1/2-x, 3/2-y, 2-z; b: x, 1+y, z
Table 1. Crystal data and structure refinement for complexes 1 and 2
Complex 1 2 Empirical formula C44H38CuN4O4 C38H30CuN4O4 Formula weight 750.32 670.21 Crystal system Triclinic Monoclinic Space group P1 C2/c a/nm 0.781 30(6) 2.940 0(4) b/nm 0.939 05(8) 0.584 20(7) c/nm 1.237 2(1) 1.870 0(2) α/(°) 94.549(2) 90 β/(°) 93.738(1) 102.660(2) γ/(°) 91.377(1) 90 V/nm3 0.902 6(1) 3.159 3(4) Z 1 4 Dc/(g.cm3) 1.38 1.409 μ/(mm-1) 0.656 0.74 F(000) 391 1 388 θ range for data collection/(°) 2.61~25.02 1.41~25.10 Limiting indices -7≤h≤9;-9≤k≤11;-14≤l≤13 -35≤h≤33;-6≤k≤6;-22≤l≤22 Reflections collected, unique 4 607, 3 119(Rint=0.073 4) 7 968, 2 805(Rint=0.086 0) Completeness to θ/% 97.8(θ=25.02°) 100%(θ=25.10°) Data, restraints, parameters 3 119, 0, 242 2 085, 0, 216 GOF on F2 1.027 0.965 Final R indices [I > 2σ(I)] R1=0.080 0, wR2=0.175 8 R1=0.057 0, wR2=0.130 1 R indices (all data) R1=0.128 9, WR2=0.196 5 R1=0.107 3, wR2=0.157 4 (△ρ)max, (△ρ)min/(e • nm-3) 521, -526 941, -876  下载: 导出CSV
Table 2. Main bands in IR spectra of the ligand HL1, HL2 and their Cu (Ⅱ) complexes
cm-1 ν(C=N) ν(Ar-0) ν(Cu-N) ν(Cu-0) ν(C=C) benzene ring skeleton HL1 1 617 1 178 - - 1 564 1 490 1 452 Complex 1 1 600 1 144 540 503 1 531 1 500 1 445 HL2 1 620 1 182 - - 1 589 1 543 1 483 Complex 2 1 602 1 137 519 463 1 548 1 526 1 456
下载: 导出CSV
Table 3. Selected bond lengths (nm) and bond angles (°) for complexes 1 and 2
1 Cul-02a 0.l88 8(4) Cul-02 0.l88 8(4) Cul-N2a 0.200 0(4) Cul-N2 0.200 0(4) 02a-Cul-02 l80.00(l) 02-Cul-N2a 88.35(2) N2a-Cul-N2 l80.00(2) C5-N2-Cul l2l.8(4) 02a-Cul-N2a 9l.65(2) 02a-Cul-N2 88.35(2) C9-N2-Cul l2l.5(3) Cll-02-Cul l27.0(4) 2 Cul-0lb 0.l88 5(3) Cul-0l 0.l88 5(3) Cul-Nlb 0.20l 4(3) Cul-Nl 0.20l 4(3) 0l-Cul-0lb l80.00(9) 0l-Cul-Nlb 89.6l (l) Nlb-Cul-Nl l79.99(2) Cl2-N2-Cul l20.7(3) 0lb-Cul-Nlb 90.39(l) 0lb-Cul-Nl 89.6l (l) Cll-N2-Cul l23.l (3) C7-0l-Cul l30.5(3) Symmetry codes: a: 1-x, 1-y, 1-z for 1;b:-x, -y+1, -z+2 for 2
下载: 导出CSV
Table 4. Putative π-π stacking interactions for complex 1
Ring (I) Ring (J) d (Cg-Cg)/nm d (Cg (I)-perp)/nm d (Cg (J)-perp)/nm Slippage/nm Cgl* Cg1 0.406 6(4) 0.353 8(3) 0.353 7(3) 0.200 5 Cg2* Cg2 0.387 2(4) 0.357 3(3) 0.357 3(3) 0.l49 2 *Cgl and Cg2 are the centroids of benzene ring Cl0-Cl5 and Cl7-C22 of complex 1, respectively
下载: 导出CSV
Table 5. Hydrogen-bonding for complex 2
D-H…A d (D-H)/nm d (H…A)/nm d (D…A)/nm ∠DHA/(°) Symmetry code 02-H2A…N2 0.082 0 0.208 0.278 9 (6) l45 l/2-x, 3/2-y, 2-z Cl7-Hl7…Cg3* 0.093 0 0.295 0.379 8(4) l53 x, l+y, z *Cg3 is the centroid of benzene ring Cl-C5-Cl0 of complex 2
下载: 导出CSV
-


 扫一扫看文章
计量
- PDF下载量: 0
- 文章访问数: 768
- HTML全文浏览量: 107
 下载:
下载:
