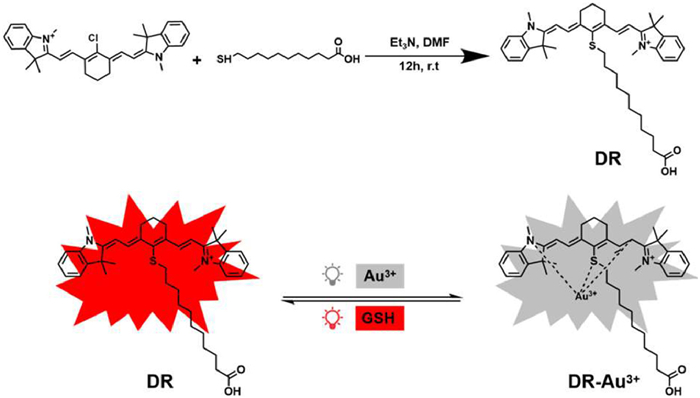
Scheme 1.
Synthesis and fluorescence response of DR to Au3+ and GSH.
A near-infrared fluorescent probe based on Au3+/Pd2+ complexes for glutathione sensing: Applications in acute liver injury, hepatocellular carcinoma, and ferroptosis exploration
Ru Ding , Chunfei Wang , E Lv , Jingjing Zhao , Xucong Zhou , Yuanyi Li , Ying Wang , Bingxue Li , Lixia Zhang , Jin Zhou

The liver is the central metabolic organ, responsible for energy metabolism, detoxification, bile secretion, and immune regulation [1]. Liver injury, caused by overnutrition, autoimmune hepatitis, cholestasis, excessive alcohol, viral infections, and drug abuse, can progress to fibrosis, cirrhosis, liver failure, or cancer, seriously endangering health. Liver diseases are characterized by high incidence, treatment difficulty, and a tendency to recur [2]. Existing diagnostic technologies, such as liver biopsy, ultrasound, computed tomography (CT), magnetic resonance imaging (MRI), and biomarker detection in serum samples, often face challenges such as insufficient sensitivity and specificity in dynamic monitoring of liver diseases, as well as the complexity of the methods [3]. Therefore, it is urgent to develop more precise, simple, and efficient diagnostic methods to improve early detection accuracy and clinical applicability of liver diseases.
Glutathione (GSH) is an endogenous tripeptide abundantly present in human cells, especially in the liver [4]. It is crucial for maintaining cellular redox homeostasis, scavenging reactive oxygen species (ROS), protecting against oxidative damage, and regulating metabolism, detoxification, and cell death processes such as apoptosis, necrosis, and autophagy. Altered GSH levels are implicated in various diseases, including cancer, acquired immune deficiency syndrome (AIDS), liver injury, diabetes, and aging [5]. In cancer, GSH is often elevated [6], whereas its depletion is strongly linked to the progression of acute alcoholic liver injury (AALI) and drug-induced liver injury (DILI) [7,8]. Thus, dynamic monitoring of GSH is clinically important for early diagnosis, disease progression, and therapeutic evaluation in liver diseases.
Ferroptosis is a non-apoptotic, iron-dependent form of cell death, distinguished by GSH depletion, impaired glutathione peroxidase-4 (GPX4) activity, and accumulation of lipid ROS [9]. It plays a critical role in liver injury, where excessive ROS from alcohol and drug metabolism deplete intracellular GSH, intensifying lipid peroxidation and triggering ferroptosis [10]. Ferroptosis inducers promote cancer cell death by depleting GSH and inhibiting GPX4, offering novel therapeutic targets and strategies for liver cancer treatment and advancing cell death regulation in oncology [11]. Consequently, ferroptosis has emerged as a key research focus in the diagnosis and therapy of liver diseases.
Traditional methods for detecting GSH, such as chromatography, mass spectrometry, Raman spectroscopy, electrochemical methods, magnetic resonance imaging, and colorimetric methods, typically require complex sample preprocessing, which limits their application in rapid and convenient real-time detection [12]. In recent years, near-infrared (NIR) fluorescent probes have garnered increasing interest due to their distinct optical advantages, including minimal background interference, improved sensitivity and signal stability, and excellent tissue penetration depth [13-18]. Therefore, designing high-sensitivity NIR fluorescence probes for real-time monitoring of GSH can effectively overcome the limitations of traditional methods.
We have developed a DR-Au3+/DR-Pd2+ complex probe capable of efficiently and selectively detecting the dynamic changes of GSH in the hepatic microenvironment. This probe exhibits significant NIR fluorescence response upon interaction with GSH, with high sensitivity, excellent liver targeting ability, and low cytotoxicity. These features make it highly promising for precise diagnosis and treatment of liver diseases. Moreover, the optimized DR-Au3+ fluorescence probe was employed to systematically investigate the dynamic changes of GSH in models of AALI, DILI, and hepatocellular carcinoma (HCC), and explored its role in the regulation of ferroptosis. By monitoring GSH fluctuations dynamically, this study provides an effective tool for early diagnosis and tracking the progression of liver injury, offering theoretical support and experimental evidence for the development of personalized treatment strategies for liver diseases.
The synthesis and detection mechanism are illustrated in Scheme 1. We designed a fluorescent probe, DR, capable of detecting GSH via metal ion complexation. Upon binding with Au3+ or Pd2+, DR forms DR-Au3+ or DR-Pd2+ complexes through coordination with nitrogen, oxygen, or olefin groups, leading to fluorescence quenching due to electronic structure changes. Upon GSH addition, fluorescence is restored, likely because GSH chelates the metal ions, dissociating the complex and releasing free DR [19,20]. This reversible process enables sensitive, real-time detection of GSH. Characterization of compound DR is shown in Figs. S1–S3 (Supporting information).
Preliminary selectivity studies showed that the DR probe selectively recognizes Au3+ and Pd2+ ions in an ethanol/phosphate buffered saline (PBS) (2:8, v/v, pH 7.4) system. Addition of Au3+ or Pd2+ led to marked decreases in fluorescence emission at 805 nm and absorbance at 775 nm (Fig. S4 in Supporting information). Increasing Au3+ concentrations (0–100 µmol/L) resulted in a gradual decline in fluorescence, plateauing above 20 µmol/L, accompanied by a color change from green to yellow and corroborated by IVIS imaging (Fig. S5A in Supporting information). The probe displayed a linear fluorescence response to Au3+ in the 0–1 µmol/L range (R2 = 0.978), and the limit of detection (LOD) was 0.146 µmol/L (Fig. S5B in Supporting information). Fluorescence titration experiments, combined with Job's plot analysis, further confirmed that the binding ratio between DR and Au3+ is 1:1 (Fig. S6 in Supporting information), indicating that each DR molecule coordinates with one Au3+ ion to form a stable complex.
For Pd2+, the DR probe showed a concentration dependent decrease in fluorescence from 0 to 100 µmol/L, reaching a plateau above 20 µmol/L. This change was accompanied by a visible color shift and IVIS imaging results similar to those observed with Au3+ (Fig. S7A in Supporting information). Within the 0–10 µmol/L range, the probe exhibited a strong linear fluorescence response (R2 = 0.992), and the detection limit was 0.535 µmol/L (Fig. S7B in Supporting information). The probe demonstrated high sensitivity and selectivity for both Au3+ and Pd2+, with clear linearity within defined concentration ranges, suggesting strong potential for practical applications. Further selectivity assessment with various biological analytes, including amino acids, peptides such as GSH, enzymes like tyrosinase, ROS, metal cations, and anions, revealed that only Au3+ and Pd2+ caused significant fluorescence quenching at 805 nm (Fig. S8 in Supporting information). Competitive experiments confirmed that the DR probe maintained selectivity for Au3+ and Pd2+ even in the presence of other biological species (Fig. S8). The probe also showed stable fluorescence over a broad pH range (3.55–12.23) and temperature range (4–45 ℃), minimal influence from reaction time (stabilizing within 30 min), and excellent photostability under continuous 745 nm laser irradiation (Figs. S9–S12 in Supporting information). Together, these results demonstrate that the DR probe possesses robust stability, high selectivity, and reliability under a variety of physiological and environmental conditions.
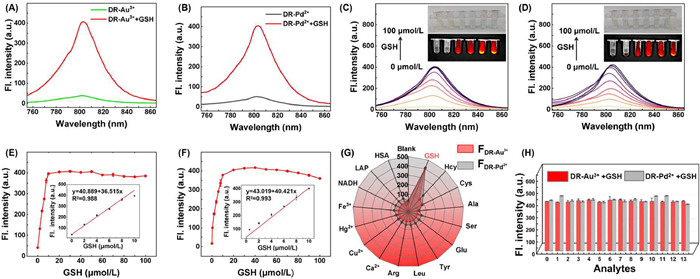
Fluorescence and absorption studies confirmed that both DR-Au3+ and DR-Pd2+ exhibit high selectivity for GSH, with GSH addition resulting in significant increases in fluorescence at 805 nm and absorbance at 775 nm (Figs. 1A and B, Fig. S13 in Supporting information). Fluorescence intensity increased with GSH concentration (0–100 µmol/L), plateauing above 10 µmol/L, and was accompanied by a visible color shift from yellow to green and enhanced IVIS imaging (Figs. 1C and D). Both probes exhibited excellent linearity in response to low concentrations of GSH, with correlation coefficients of R2 = 0.988 for DR-Au3+ and R2 = 0.993 for DR-Pd2+ (Figs. 1E and F). The limits of detection were determined to be 0.116 and 0.102 µmol/L, respectively. To assess the specificity of DR-Au3+/DR-Pd2+ for GSH, the probes were co-incubated with other substances, including cysteine (Cys), homocysteine (Hcy), Ca2+, Hg+, Fe3+, Cu2+, arginine (Arg), leucine (Leu), tyrosinase (TYR), glutamic acid (Glu), serine (Ser), alanine (Ala), human serum albumin (HSA, Beijing Solarbio Science & Technology Co., Ltd.), lactase (LAP), nicotinamide adenine dinucleotide (NADH), and others. Radar plots showed that at excitation/emission wavelengths of 745/805 nm, the fluorescence response of DR-Au3+ and DR-Pd2+ to GSH was significantly higher than those of other potential interfering substances, confirming the excellent selectivity of the probe for GSH (Fig. 1G). To study the anti-interference capability of fluorescence, competitive experiments were conducted. In solution containing DR-Au3+/DR-Pd2+, GSH was added, followed by other potential interfering substances for co-incubation. Experimental results (Fig. 1H) showed that these common interfering substances had almost no effect on the fluorescence response for GSH detection, further confirming the outstanding anti-interference capability of DR-Au3+/DR-Pd2+. Meanwhile, the response time of DR-Au3+ and DR-Pd2+ to GSH was 20 min, showing rapid responsiveness (Fig. S14 in Supporting information). The probes maintained stable fluorescence across broad pH (3.55–12.23) and temperature (4–45 ℃) ranges (Figs. S15 and S16 in Supporting information), and showed robust photostability under prolonged 745 nm laser irradiation (Fig. S17 in Supporting information). Reversibility was validated by repeatable fluorescence changes with alternate addition of Au3+/Pd2+ and GSH (Fig. S18 in Supporting information). Overall, the DR probe exhibits excellent selectivity, stability, and reversibility for GSH detection, even in complex environments.
Before live-cell imaging, the biocompatibility of the DR probe was evaluated using MTT assays in HeLa, Hepa1–6, and HepG2 cells. Cell viability remained above 80% after 12 h of incubation with 0–20 µmol/L DR (Fig. S19 in Supporting information), suggesting low cytotoxicity. Fluorescence imaging in HepG2 cells showed a concentration-dependent increase in signal, with 10 µmol/L sufficient for clear imaging (Fig. S20 in Supporting information). Time-course experiments revealed detectable fluorescence within 5 min of incubation (Fig. S21 in Supporting information), confirming rapid uptake and strong imaging capability. Co-incubation with increasing Au3+/Pd2+ concentrations showed minimal fluorescence change (Fig. S22 in Supporting information), likely due to high intracellular GSH buffering the quenching effect.
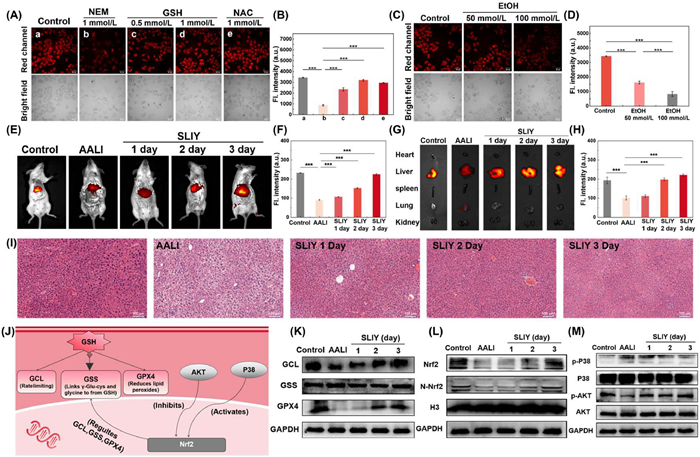
N-Ethylmaleimide (NEM) and buthionine sulfoximine (BSO) are GSH inhibitors that reduce intracellular GSH via different mechanisms; NEM modifies thiol groups, while BSO blocks GSH synthesis by inhibiting γ-glutamylcysteine synthetase [21]. As shown in Fig. S23 (Supporting information), treatment with these inhibitors, especially 5 mmol/L NEM, led to a significant decrease in DR-Au3+ fluorescence, indicating that its signal is dependent on GSH levels. To further verify specificity, cells were pretreated with NEM and then incubated with GSH or N-acetylcysteine (NAC). As shown in Figs. 2A and B, GSH and NAC restored fluorescence, confirming that DR-Au3+ can sensitively detect and visualize endogenous GSH in liver cancer cells. We used the DR-Au3+ probe to monitor GSH dynamics in the AALI model. First, HepG2 cells were treated with different concentrations of H2O2 to induce oxidative stress. As shown in Fig. S24 (Supporting information), the red fluorescence intensity gradually decreased with increasing H2O2 concentration, confirming that the probe has good sensitivity to GSH depletion. Further, alcohol-treated liver cancer cells were used to model alcohol-induced injury [22,23]. As shown in Figs. 2C and D, alcohol (100 mmol/L) significantly reduced fluorescence due to ROS-induced oxidative stress and GSH consumption. These findings demonstrate the probe's reliability in detecting GSH under cellular stress.
Before in vivo experiments, the biocompatibility of DR was assessed. Hemolysis tests showed that after incubating DR (5, 10, 15, and 20 µmol/L) with blood cells at 37 ℃ for 3 h, the hemolysis rate remained low (< 3.48%) even at 20 µmol/L, indicating good blood compatibility (Fig. S25 in Supporting information). In addition, hematoxylin and eosin (H&E) staining of major organs (heart, liver, spleen, lung, and kidney) from mice subjected to tail vein injection of DR or DR-Au3+ revealed no significant histopathological abnormalities (Fig. S26 in Supporting information). These findings indicate low biotoxicity and support the suitability of the probes for in vivo imaging. All the in vivo experimental procedures were approved by the Animal Ethical Experimentation Committee of Shandong Second Medical University and were performed strictly in accordance with the guidance of the National Act on the use of experimental animals.
We used the DR-Au3+ probe to detect changes of GSH levels in a mouse AALI model. The AALI model was successfully established [22,24], and H&E staining confirmed the model (Fig. S27 in Supporting information). The H&E staining results showed that liver cells in the control group appeared normal, with neatly arranged liver cords radiating evenly. In contrast, the AALI group exhibited abnormal liver cells, with disordered arrangement of hepatic cords and enlarged intercellular spaces, accompanied by hemorrhages. We used the DR-Au3+ probe to detect changes in GSH levels in the AALI mouse model. First, real-time imaging was performed by tail vein injection of DR-Au3+ in mice. Fluorescence signals were detectable 5 min after injection (Fig. S28 in Supporting information), and the signal reached a plateau after 40 min, indicating that the probe has excellent in vivo imaging performance.
In follow-up experiments, mice were divided into control, AALI model, and silymarin (SILY) treatment groups. SILY, a clinically used drug for AALI [24], was administered for 1,2, or 3 days (Fig. S29 in Supporting information). DR-Au3+ was injected intravenously for fluorescence imaging (Fig. 2E). The AALI group showed significantly reduced fluorescence compared to controls, while the 3-day SILY group showed recovery of signal, indicating a therapeutic effect. Organ imaging (Fig. 2G) confirmed liver-specific fluorescence, and in vivo and ex vivo imaging results were consistent (Figs. 2F and H). H&E staining of liver tissue revealed that the AALI model displayed typical characteristics, including disorganized hepatic cords, cytoplasmic lysis, and the formation of lacunae. Notably, treatment with SILY for three days significantly alleviated these symptoms (Fig. 2I). These results suggest that GSH depletion is a key indicator of AALI, and SILY has a protective effect. DR-Au3+ effectively monitored GSH changes, showing high biocompatibility and potential for AALI diagnosis and treatment evaluation.
The normal function of GSH depends on two key processes: its synthesis and redox reactions, in which glutamate cysteine ligase (GCL) and glutathione synthetase (GSS) are the critical enzymes in the GSH synthesis pathway. GCL is the rate-limiting enzyme in GSH synthesis, while GSS catalyzes the conjugation of γ-glutamylcysteine with glycine to form GSH [25]. GPX4, as a key antioxidant enzyme, maintains cellular redox balance by reducing lipid peroxides. Studies have shown that nuclear factor erythroid 2-related factor 2 (Nrf2) plays a central role in GSH metabolism by regulating the expression of GCL, GSS, and GPX4, thus controlling GSH synthesis. The expression of Nrf2 is regulated by the protein kinase B (AKT) and P38 signaling pathways, with inhibition of AKT and activation of P38 leading to decreased levels of Nrf2 [26,27]. This study aims to analyze changes in GSH-related enzymes and Nrf2 signaling pathways in the AALI model by Western blot (WB), and to evaluate the effects of SILY treatment. As shown in Fig. 2J, Nrf2 plays a central role in GSH metabolism. In the AALI group, GCL and GPX4 levels were significantly reduced, while GSS remained unchanged (Fig. 2K, Fig. S30 in Supporting information), indicating GSH depletion is mainly due to GCL downregulation and decreased antioxidant capacity from reduced GPX4. Additionally, the expression levels of both Nrf2 and its activated form, nuclear-Nrf2 (N-Nrf2), were significantly reduced in the AALI model, indicating impaired regulatory function in GSH synthesis and antioxidant defense (Fig. 2L, Figs. S31A and B in Supporting information). Pathway analysis showed increased p-P38/P38 and decreased p-AKT/AKT ratios, with total protein levels unchanged (Fig. 2M, Figs. S31C and D in Supporting information), suggesting P38 activation and AKT inhibition contribute to Nrf2 suppression. SILY treatment restored GCL and GPX4 levels, had no effect on GSS, and significantly increased Nrf2 expression. It also decreased p-P38 and increased p-AKT, indicating it improves GSH synthesis and antioxidant function by modulating the P38/AKT-Nrf2 pathway. In conclusion, impaired GCL and GPX4 expression and disrupted Nrf2 signaling are major contributors to GSH dysfunction in AALI. SILY restores this pathway, offering a potential therapeutic strategy.
Acetaminophen (APAP) overdose, a common cause of DILI, results in the accumulation of the toxic metabolite N-acetyl-p-benzoquinone imine (NAPQI), which is normally detoxified by GSH. Excessive APAP depletes GSH, impairs NAPQI clearance, and leads to oxidative stress and ferroptosis, an iron-dependent cell death process central to APAP-induced liver injury [28,29]. As illustrated in Fig. S32A (Supporting information), increasing APAP concentrations in HepG2 cells significantly reduced red fluorescence, indicating GSH depletion (Figs. S32B and C in Supporting information). Similar effects were observed with erastin, confirming the association with ferroptosis. Treatment with NAC, exogenous GSH, or ferrostatin-1 (Fer-1) significantly restored fluorescence (Figs. S32D–F in Supporting information), mitigating GSH loss and cellular damage. In a mouse model, H&E staining revealed pronounced hepatocyte cytoplasmic lysis and inflammatory infiltration in the APAP group (Fig. S33 in Supporting information). To further confirm the role of ferroptosis in APAP-induced liver injury, in vivo and ex vivo imaging was performed in mice (Fig. S34 in Supporting information). DR-Au3+-based imaging showed reduced liver fluorescence in the APAP group compared to controls, while Fer-1, NAC, or GSH treatments restored the signal (Figs. 3A and B). Ex vivo imaging of organs corroborated these findings (Figs. 3C and D), with fluorescence trends consistent between in vivo and ex vivo analyses. H&E staining (Fig. S35 in Supporting information) showed that APAP injury caused disorganized hepatic cords, enlarged intercellular spaces, cytoplasmic lysis, and inflammatory infiltration, while treatment groups exhibited preserved liver architecture. These results confirm ferroptosis as a key contributor to APAP-induced liver injury and demonstrate that Fer-1, NAC, and GSH alleviate damage by preventing GSH depletion, highlighting ferroptosis as a promising therapeutic target.
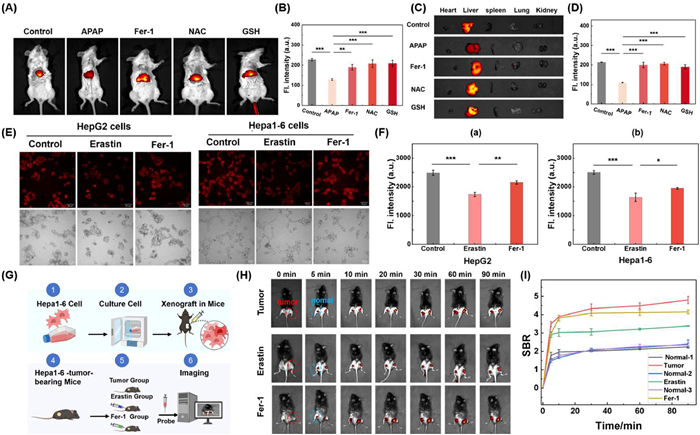
The dynamic changes of GSH and its potential role in ferroptosis in liver cancer were investigated using the DR-Au3+ probe. First, in cell experiments, Hepa1–6 and HepG2 cells were treated with the ferroptosis inducer Erastin and the ferroptosis inhibitor Fer-1, and the changes in fluorescence signals were observed (Figs. 3E and F). Erastin significantly reduced fluorescence compared to controls and Fer-1 groups, indicating rapid GSH depletion and ferroptosis induction. These findings indicate that erastin exerts its therapeutic effect in liver cancer mainly by inducing ferroptosis through GSH depletion. After confirming the excellent imaging performance of DR-Au3+ in cells, in vivo experiments were conducted (Fig. 3G). DR-Au3+ was injected into Hepa1–6 tumor-bearing mice for NIR imaging. Fluorescence in tumors increased over time, while normal tissue remained low (Fig. S36 in Supporting information). Pretreatment with NEM reduced tumor fluorescence, confirming GSH depletion (Fig. S36). To evaluate ferroptosis monitoring, tumors were pretreated with erastin before DR-Au3+ injection (Fig. 3H). Fluorescence decreased, indicating GSH loss due to ferroptosis. Subsequent Fer-1 treatment partially restored fluorescence, demonstrating ferroptosis inhibition. SBR analysis further confirmed these trends (Fig. 3I). These results indicate that DR-Au3+ enables sensitive monitoring of GSH dynamics and ferroptosis in liver cancer. Erastin induces ferroptosis via GSH depletion, showing therapeutic potential, while Fer-1 inhibits this process, confirming the key role of GSH. So DR-Au3+ imaging could serve as an effective tool for exploring the interplay between GSH and ferroptosis and facilitates the advancement of diagnostic and therapeutic approaches targeting ferroptosis.
In summary, this study reports a NIR fluorescent probe based on the DR-Au3+ complex for the sensitive detection of GSH. This system generates significant fluorescence intensity changes in the presence of GSH, exhibiting fast detection, high sensitivity, strong selectivity, and excellent liver-targeting ability. Additionally, the probe demonstrates low cytotoxicity and good biocompatibility, enabling efficient monitoring of both exogenous and endogenous GSH dynamic changes in live cells and mouse organs. In the AALI model, DR-Au3+ successfully achieved precise detection of GSH levels. Experimental results indicate that the probe has good sensitivity and specificity and can accurately reflect the dynamic changes of endogenous GSH during liver injury in real-time. In the acetaminophen-induced drug-induced liver injury model, we further revealed the key regulatory role of GSH in the process of ferroptosis. Intervention with ferroptosis inhibitors significantly improved drug-induced liver injury, suggesting that ferroptosis inhibitors hold important therapeutic potential. In the liver cancer model, our findings showed that inducing ferroptosis with GSH as a biomarker effectively inhibited tumor tissue growth, providing a novel strategy for liver cancer treatment. Using the DR-Au3+ probe, we successfully visualized and quantified the process of ferroptosis in liver cancer, providing a powerful tool for precision treatment of liver cancer. This study not only provides new insights into the role of GSH in various liver disease models but also validates the potential application value of the DR-Au3+ probe in liver injury and liver cancer therapy. This research would lay the foundation for the development of innovative therapies based on ferroptosis regulation. Future studies could further optimize the performance of the probe, expand its application in other disease models, and explore its potential for clinical diagnosis and treatment.
The authors declare that they have no known competing financial interests or personal relationships that could have appeared to influence the work reported in this paper.
Ru Ding: Validation, Methodology, Investigation, Formal analysis, Data curation. Chunfei Wang: Writing – original draft, Visualization, Validation. E Lv: Investigation. Jingjing Zhao: Investigation. Xucong Zhou: Software, Investigation. Yuanyi Li: Validation. Ying Wang: Writing – review & editing. Bingxue Li: Validation, Methodology, Investigation, Data curation. Lixia Zhang: Methodology, Investigation. Jin Zhou: Writing – review & editing.
We gratefully acknowledge financial support from the National Natural Science Foundation of China (No. 21705120), Natural Science Foundation of Shandong Province, China (Nos. ZR2023MB001, ZR2017LB016, ZR2022QB165), Special Fund for Taishan Scholar Project (Nos. tsqn202211231, tsqn202211233), Foundation of Yuandu Scholar and Science and Technology Development Plan Project of Weifang (No. 2024JZ0012).
Supplementary material associated with this article can be found, in the online version, at doi:
J. Ishikawa, M. Takeo, A. Iwadate, et al., Commun. Biol. 4 (2021) 13. doi: 10.1038/s42003-020-01551-7
J.X. Mao, L.H. Tan, C. Tian, et al., Life Sci. 337 (2024) 24.
L. Han, Y. Pan, L. Luo, et al., Talanta 287 (2025) 127694. doi: 10.1016/j.talanta.2025.127694
J. Wróblewska, M. Wróblewski, I. Holynska-Iwan, et al., Antioxidants 12 (2023) 23.
Y.X. Guo, X.D. Zhang, F.G. Wu, et al., J. Colloid. Interface Sci. 530 (2018) 511–520. doi: 10.1016/j.jcis.2018.06.041
X.D. Rong, C.Y. Liu, M.Z. Li, et al., Anal. Chem. 93 (2021) 16105–16112. doi: 10.1021/acs.analchem.1c03836
N. Ge, H. Liang, Y.Y. Zhao, et al., J. Food Sci. 83 (2018) 2612–2621. doi: 10.1111/1750-3841.14320
A.L. Fotio, M.S.D. Nguepi, L.B. Tonfack, et al., South Afr. J. Bot. 129 (2020) 317–323. doi: 10.1016/j.sajb.2019.08.037
A. Jelinek, L. Heyder, M. Daude, et al., Free Radic. Biol. Med. 117 (2018) 45–57. doi: 10.1016/j.freeradbiomed.2018.01.019
Y.Q. Zhang, R.R. Dong, H.L. Zhou, et al., J. Agric. Food Chem. 72 (2024) 16323–16333. doi: 10.1021/acs.jafc.4c02912
Z.L. Yan, S.J. Wu, Y. Zhou, et al., ACS Biomater. Sci. Eng. 8 (2022) 2508–2517. doi: 10.1021/acsbiomaterials.2c00236
N. Li, T. Wang, N. Wang, et al., Chem. Int. Ed. 62 (2023) 12.
W. Zhang, L. Yang, Z. Jin, et al., Chin. Chem. Lett. (2025), doi:10.1016/j.cclet. 2025.111220.
Q. Pang, F. Huo, Y. Yue, et al., Chin. Chem. Lett. 36 (2025) 110713. doi: 10.1016/j.cclet.2024.110713
B. Zhao, X.H. Xu, X. Wen, et al., Anal. Chem. 96 (2024) 5992–6000. doi: 10.1021/acs.analchem.4c00328
K. Yang, B. Zheng, F. Wu, et al., Chin. Chem. Lett. (2025), doi:10.1016/j.cclet. 2025.111235.
X. Yang, C. Wang, D. Wang, et al., Chin. Chem. Lett. (2025), doi:10.1016/j.cclet. 2025.111215.
M. Wu, K. Wu, S. Feng, et al., Chin. Chem. Lett. (2025), doi:10.1016/j.cclet.2025. 110979.
G.J. He, X.B. Hua, N. Yang, et al., Bioorganic. Chem. 91 (2019) 6.
Z.Q. Hu, L.L. Sun, Y.Y. Gu, et al., Sens Actuator B: Chem. 212 (2015) 220–224. doi: 10.1016/j.snb.2015.01.084
J. Zhang, Y.C. Zhang, Q. Guo, et al., ACS Sens. 7 (2022) 1105–1112. doi: 10.1021/acssensors.2c00058
R.N. Wang, X.C. Zhou, B.X. Li, et al., Chem. Commun. 60 (2024) 5.
G. Nie, J.J. Che, Y.Z. Feng, et al., Dyes Pigment 219 (2023) 9.
S. Wang, X.J. Zhao, M.M. Liu, et al., Biosens. Bioelectron. 239 (2023) 8.
D. Lapenna, Ageing Res. Rev. 92 (2023) 30.
Y. Ding, K.J. Choi, J.H. Kim, et al., Am. J. Pathol. 172 (2008) 1529–1541. doi: 10.2353/ajpath.2008.070429
L. Xia, Y.Q. Chen, J.T. Li, et al., Chin. Med. J. 136 (2023) 1977–1989. doi: 10.1097/CM9.0000000000002772
F.W. Sun, Y.Y. Peng, Y.P. Li, et al., Chin. Chem. Lett. 34 (2023) 107507. doi: 10.1016/j.cclet.2022.05.021
J.Q. Tao, C.L. Xue, X.D. Wang, et al., Int. J. Med. Sci. 20 (2023) 1616–1630. doi: 10.7150/ijms.85114

Figure 1 (A, B) Fluorescence spectral changes of DR-Au3+ (10 µmol/L, composed of 10 µmol/L DR and 10 µmol/L Au3+) and DR-Pd2+ (10 µmol/L, composed of 10 µmol/L DR and 10 µmol/L Pd2+) with GSH (10 µmol/L) before and after reaction in ethanol/PBS (2:8, v/v, pH 7.4). (C, D) Fluorescence spectral changes of DR-Au3+ (10 µmol/L) and DR-Pd2+ (10 µmol/L) in the presence of different GSH concentrations (0–100 µmol/L) in solution. Inset: visual color changes under daylight with the addition of different GSH concentrations (0, 5, 7, 10, 20, 30 µmol/L) and fluorescence imaging using the IVIS spectrum in vivo imaging system. (E, F) Fluorescence intensity of DR-Au3+ and DR-Pd2+ at 805 nm as a function of GSH concentration. Insets show the corresponding linear relationships. (G) Radar chart showing the fluorescence intensity distribution of DR-Au3+ in the presence of various analytes. The analytes include: solution: blank (PBS), GSH (10 µmol/L), Hcy (10 µmol/L), Cys (10 µmol/L), Ala (10 µmol/L), Ser (10 µmol/L), Glu (10 µmol/L), Try (10 µmol/L), Leu (50 µmol/L), Arg (100 µmol/L), Ca2+ (10 µmol/L), Cu2+ (100 µmol/L), Hg+ (10 µmol/L), Fe3+ (10 µmol/L), NADH (10 µmol/L), LAP (0.9 µg/mL), and HSA (0.1 g/L). (H) Investigation of the anti-interference selectivity of DR-Au3+ and DR-Pd2+ in the presence of GSH against common interfering substances. The selected interfering substances include: (0) control; (1) Ala (10 µmol/L); (2) Ser (10 µmol/L); (3) Glu (10 µmol/L); (4) Try (10 µmol/L); (5) Leu (50 µmol/L); (6) Arg (100 µmol/L); (7) Ca2+ (10 µmol/L); (8) Cu2+ (100 µmol/L); (9) Hg+ (10 µmol/L); (10) Fe3+ (10 µmol/L); (11) NADH (10 µmol/L); (12) LAP (0.9 µg/mL); (13) HSA (0.1 g/L). λex/em =745/805 nm. Data are presented as mean ± standard deviation (SD) (n = 3).

Figure 2 (A) Validation of the specificity of DR-Au3+ for GSH detection in HepG2 cells. Cells were divided into five groups: the control group (a), NEM-treated group (b), two groups treated with 0.5 mmol/L GSH (c) and 1 mmol/L GSH (d) after NEM pre-treatment, and the group treated with 1 mmol/L NAC (e) following NEM pre-treatment. Finally, cells were incubated in a medium containing DR-Au3+ (10 µmol/L) for 30 min for fluorescence imaging. Red channel: λex = 785 nm, λem = 805–814 nm. Scale bar: 50 µm. (B) Quantification of fluorescence intensity in (A). (C) AALI model established by pretreating HepG2 cells with 50 or 100 mmol/L ethanol for 30 min, followed by incubation with DR-Au3+ (10 µmol/L) for 30 min. (D) Quantitative fluorescence analysis of (C). (E) In vivo fluorescence imaging of normal, model, and SILY-treated mice after tail vein injection of DR (100 µmol/L, 100 µL). λex/em = 745/805 nm. (G) Ex vivo fluorescence imaging of major organs (heart, liver, spleen, lung, kidney). (F, H) Quantitative analysis of fluorescence intensity from (E) and (G). (I) Representative H&E staining of liver tissues from normal, AALI model, and SYLI-treated mice. Scale bar: 100 µm. (J) Schematic illustration of Nrf2-mediated regulation of GSH metabolism. (K) WB analysis of GCL, GSS, and GPX4 protein levels in liver tissues from control and AALI mice. (L) WB analysis of total Nrf2 and N-Nrf2 protein levels. (M) WB analysis of phosphorylated and total P38 and AKT proteins in liver tissues. Data are presented as mean ± SD (n = 3), ***P < 0.001. GAPDH, glyceraldehyde-3-phosphate dehydrogenase.

Figure 3 (A) In vivo fluorescence imaging of normal mice, model mice, and treated mice via tail vein injection of DR-Au3+ (100 µmol/L, 100 µL). (C) Ex vivo fluorescence imaging of major organs (heart, liver, spleen, lung, kidney) from the mice. λex/em = 745/805 nm. (B, D) Normalized fluorescence intensity of mice and ex vivo organs shown in (A, C). (E) Effects of Erastin and the ferroptosis inhibitor Fer-1 on DR-Au3+fluorescence signals in HepG2 and Hepa1–6 cells. The cells were divided into three treatment groups: 1. control group; 2. incubated with 1 mmol/L erastin for 12 h, followed by incubation with the probe for 30 min; 3. incubated with 1 mmol/L Fer-1 for 12 h, followed by incubation with the probe for 30 min. Red channel: λex = 785 nm, λem = 805–814 nm. Scale bar: 50 µm. (F) Quantitative analysis of the fluorescence intensity shown in (E). (G) Experimental design for the liver cancer mouse model. (H) NIR fluorescence detection of endogenous GSH during ferroptosis treatment in Hepa1–6 tumor-bearing mice using DR-Au3+ (20 µmol/L, 25 µL). Real-time fluorescence imaging was performed after intratumoral injection of the probe in different groups of mice: (1) direct intratumoral injection of the probe, (2) pretreatment with 2 mmol/L erastin for 24 h followed by intratumoral injection of the probe, or (3) pretreatment with 2 mmol/L erastin for 24 h followed by 2 mmol/L Fer-1 for 4 h, and then intratumoral injection of the probe. (I) Time-dependent SBR (the fluorescent ratio of normal or tumor and blank) of normal and tumor area, as shown in panel (H), the intensity of that in normal tissue treated with probe group was defined as 1.0. Data are presented as mean ± SD (n = 3). P < 0.05, **P < 0.01, ***P < 0.001.

 扫一扫看文章

扫一扫关注我们
 DownLoad:

 下载:
下载:
 下载:
下载: