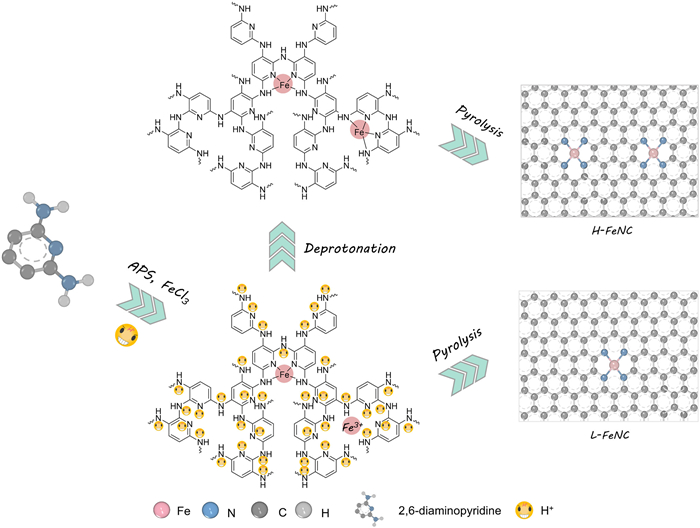
Scheme 1.
Schematic illustration of the preparation procedure of Fe-N-C catalysts.
Deprotonation effect doubles active site density in Fe-N4-C catalyst for oxygen reduction electrocatalysis
Zhili Yang , Liqun Liu , Xuebi Rao , Zeyu Jin , Jialin Sun , Yongkang Zhu , Shiming Zhang

Oxygen reduction reaction (ORR) is an important electrocatalytic process at the cathode of metal-air batteries and fuel cells which have been considered to be the next generation of electrochemical energy technologies [1-3]. Therefore, the development of practical electrocatalysts with high efficiency, excellent activity, good stability/durability, and low cost, has become an ongoing goal in the field of ORR electrocatalysis [4-6]. Compared with precious metal catalysts such as platinum (Pt) and its alloys, iron-nitrogen-carbon (Fe-N-C) materials as a class of promising non-precious metal catalysts have received extensive attention and research because of their smart design and abundant reserves [7-10], and the atomically dispersed Fe-N4 species are confirmed as the strong active sites [9-12]. However, the electrocatalytic ORR performance of Fe-N-C catalysts can still be greatly restricted by the unsatisfactory intrinsic activity and low density of active sites. On the one hand, some reasonable regulations of heteroatoms-doping [13-18], coordination environment [19-22], curvatures [23-25], defects [26-28], and bimetallic structures [29-34], are used to optimize the geometric and electronic structures of active sites to enhance the intrinsic activity. On the other hand, it will also be critical to develop effective strategies to increase the active site density in the synthesis of Fe-N-C catalysts.
The high-temperature pyrolysis of cost-effective mixtures of N-containing compounds, Fe salts, and carbons has emerged as a popular solution for high-performance Fe-N-C catalysts [35-38]. Notably, significant advancements in electrocatalytic ORR performance have been achieved through the precise design of pyrolytic precursors, particularly by coating the Fe-dispersed N-containing polymers onto the surface of carbon black [39-44]. Compared to N-containing compounds such as organic molecules and macrocycles, these N-containing polymers offer significant advantages in the construction of Fe-N-C catalysts. They can effectively coordinate with metal atoms, enabling the precise engineering of highly active catalytic sites. Furthermore, their superior thermal stability facilitates the formation of high-density Fe-N4 active sites with enhanced chemical and electrochemical stability. For example, Wu et al. [39] reported that polyaniline (PANI) with the N-containing groups connected aromatic rings as a template compound could facilitate the high-density incorporation and uniform distribution of active sites. When intentionally combining the two precursors of PANI and cyanamide (CM), the CM as a pore former would result in a hierarchical pore structure to help anchor the Fe-N4 active sites [40]. Also, Sun and co-workers [41,42] selected poly(m-phenylenediamine) (PmPDA) with more nitrogen content and higher thermostability to further improve the ORR performance of Fe-N-C catalysts. Subsequently, Chen et al. [43,44] employed the N-rich 2,6-diaminopyridine (DAP) as a precursor to successfully prepare the Fe-N-C catalysts with densely accessible Fe-N4 active sites, expressing the outstanding ORR activity as cathode catalysts in Zn–air battery and proton exchange membrane fuel cell. Generally, in the synthetic process of N-containing polymers, the oxidative polymerization of monomer molecules is needed to proceed under acidic conditions. Given the N-functional groups as nucleophiles are easily protonated by binding with electrophilic hydrogen ions (H+), the acidic environment will result in competitive adsorption behavior between H+ and metal ions on N-functional groups. This phenomenon will not be conducive to the Fe-N coordination, severely restricting the high-density formation of Fe-N4 active sites [45-47]. Thermodynamically, the H+ can have a higher chemical affinity with N-groups than metal ions during the adsorption process, therefore H+ can be a strong competitor of metal ions [46]. Thus, it is critical to mitigate or eliminate the competitive adsorption of H+ to Fe ions for the achievement of high-density Fe-N4 active sites in the Fe-N-C catalysts.
In this work, we introduce a protonation elimination process in the oxidative polymerization of amine compounds under the acidic solution, and the deprotonation effect can double the number of Fe-N4 active sites in Fe-N-C catalyst. Theoretical calculations confirm that the deprotonation of N-functional groups is beneficial to their coordination with Fe ions derived from the result of a significantly reduced Gibbs free energy. The high-density Fe-N4 active sites can greatly improve the electrocatalytic activity of Fe-N-C catalyst and the electrochemical performance of Zn-air battery. As a universal strategy, the deprotonation effect can be applied to different systems of diverse N-containing polymers and transition-metal ions.
As shown in Scheme 1, the Fe-N-C catalysts were synthesized through high-temperature pyrolysis of poly(2,6-diaminopyrodine) with Fe-doping (Fe-PDAP) coated Ketjenblack EC600JD carbon black. In brief, 2,6-diaminopyridine (DAP) was mixed with carbon black in an HCl solution, followed by adding the mixture solution of ammonium persulfate (APS) and FeCl3 to trigger the oxidative polymerization reaction. Finally, the Fe-PDAP was coated on the surface of EC600JD, and the Fe atom coordinated with N-functional groups to form the Fe-Nx structure based on Lewis acid-base theory. Under the acidic condition, N with a lone pair of electrons will tend to combine with hydrogen ions (H+) to form the protonated N-functional groups (Reaction S1 in Supporting information). Generally, such protonation can weaken the Fe-N binding interaction to hinder the formation of Fe-Nx structure [45-47]. After the high-temperature pyrolysis, there is only a low density of Fe-N4 active site in the L-FeNC catalyst. In this work, a deprotonation effect has been proposed that the addition of KOH solution can eliminate the protonation (Reaction S2 in Supporting information), which facilitates the Fe-N coordination. After finishing the polymerization reaction in the HCl solution, a certain amount of KOH solution was poured into the aforementioned suspension to adjust the pH value. This deprotonation will be conducive to strong Fe-N coordination. As a result, a doubling of Fe-N4 site density can be realized in the H-FeNC catalyst. Mainly, to verify the deprotonation process, X-ray photoelectron spectroscopy (XPS) analysis was conducted on two precursors of L-FeNC and H-FeNC (Fig. S1 in Supporting information). For the L-FeNC precursor, there are three characteristic peaks of -N= (~398.6 eV), -NH- (~399.5 eV), and -H2N+-/-HN+= (~400.8 eV) [47-49]. Upon the addition of KOH, the deprotonation leads to the disappearance of the -H2N+-/-HN+= signals, which are transformed into -NH- and -N= species in the H-FeNC precursor.
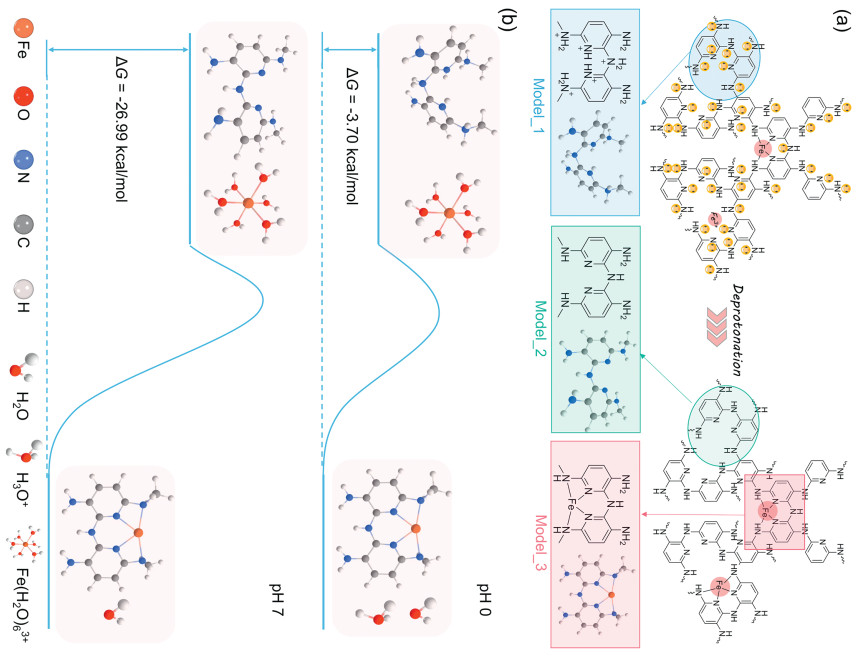
The density functional theory (DFT) calculations were performed to investigate the effect of deprotonation on Fe-N coordination in the Fe-PDAP. Based on the Lewis acid-base theory, the pyridinic-N and amino-N groups of PDAP can be protonated by combining with H+ under acidic conditions. However, under neutral/alkaline conditions the protonation will greatly weaken and/or disappear. Given the proposed deprotonation process (Fig. 1a), three typical local configurations have been cut out from the PDAP-based structures, and their models can be represented as Model_1, Model_2, and Model_3, respectively. There is a distinct difference in Gibbs free energy change (∆G) for the two binding processes between N-groups of PDAP and hydrated trivalent Fe ion (Fig. 1b). According to Reactions 1 and 2, the ∆G values are −3.70 kcal/mol under pH 0 and −26.99 kcal/mol under pH 7, respectively. These theoretical calculation results indicate that the deprotonation of N-groups can effectively drive the coordination reaction with metal ions, therefore increasing the Fe-N4 active site density in the final Fe-N-C catalysts.
Scanning electron microscopy (SEM) was used to verify the formation of Fe-PDAP coated EC600JD precursors and Fe-N-C catalysts. Fig. S2 (Supporting information) displays their holistic morphologies of amorphous carbon aggregates. In fact, the EC600JD surface should be covered with Fe-PDAP polymers in the two catalyst precursors (Fig. S3 in Supporting information) and the Fe-N doped carbon shells in the two Fe-N-C catalysts (Fig. S4 in Supporting information). The SEM-EDS results (Fig. S5 in Supporting information) show that there are four elements of C, N, O, and Fe in two L-FeNC and H-FeNC catalysts, with Fe contents of 0.09 at% and 0.16 at%, respectively. The ICP−OES tests confirm that the total Fe contents in L-FeNC and H-FeNC are 0.13 wt% and 0.45 wt%, respectively. That is, the deprotonation effect can help increase the Fe content in Fe-N-C catalyst. Furthermore, transmission electron microscopy (TEM) shows that the curved shells can be clearly visible on the surface of H-FeNC catalyst (Fig. 2a). The high-resolution TEM image (Fig. S6 in Supporting information) indicates that these nanostructures show well crystallized graphite layers without Fe-crystallized phase. The high-angle annular dark-field scanning transmission electron microscopy (HAADF-STEM) and corresponding elemental mappings manifest the uniform distribution of C, N, O, and Fe elements in the H-FeNC catalyst (Fig. 2b). The aberration-corrected HAADF-STEM (AC—HAADF-STEM) was further employed to depict the atomic dispersion of Fe. In the AC—HAADF-STEM images of L-FeNC (Fig. 2c) and H-FeNC (Fig. 2d), the circled bright spots represent the isolated Fe single atoms. Clearly, the H-FeNC catalyst reveals a higher density of atomic Fe sites than L-FeNC catalyst.
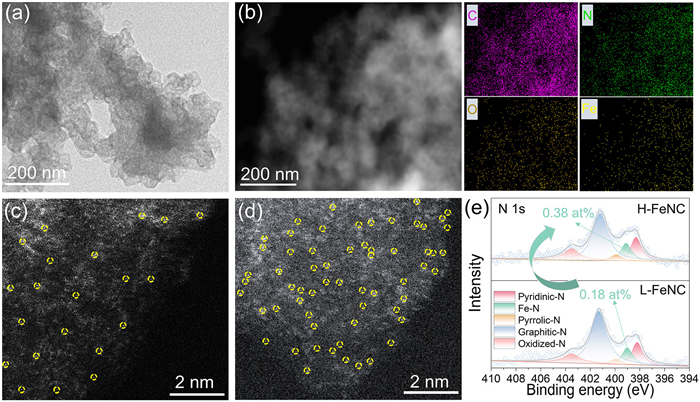
The powder X-ray diffraction (XRD) technique was carried out, and the XRD patterns of various samples are shown in Fig. S7 (Supporting information). Typically, there are only two board peaks at ~24.6° and ~43.3°, which can be assigned to C (002) and C (101) diffractions of the carbon plane, respectively. XPS analysis was also used to investigate the elemental composition of the catalyst surface. The XPS survey spectra of the L-FeNC and H-FeNC catalysts (Fig. S8 in Supporting information) exhibit the presence of C, N, O, and Fe elements, from which the surface Fe contents are 0.16 at% (L-FeNC) and 0.26 at% (H-FeNC), respectively. Furthermore, Fig. 2e shows the high-resolution N 1s XPS spectra of L-FeNC and H-FeNC catalysts, which can be fitted by five characteristic peaks of pyridinic-N (~398.3 eV), Fe-N (~399.1 eV), pyrrolic-N (~399.9 eV), graphitic-N (~401.2 eV), and oxidized-N (~403.5 eV). More obviously, the Fe-N content in H-FeNC catalyst (0.38 at%) is twice that in L-FeNC catalyst (0.18 at%), as shown in Table S1 (Supporting information).
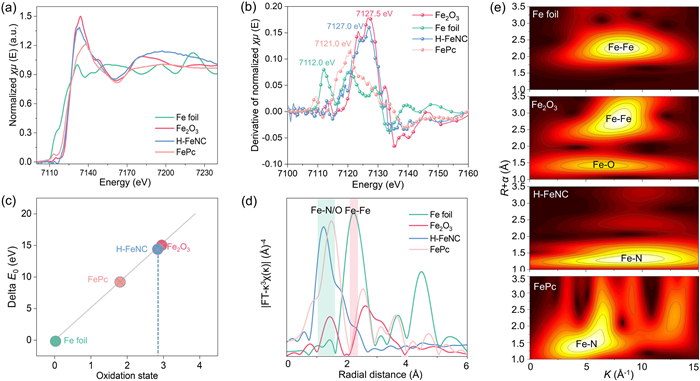
X-ray absorption fine structure (XAFS) analysis, including the X-ray absorption near-edge structure (XANES) and extended X-ray absorption fine structure (EXAFS), was employed as a premier technique to investigate the chemical state and local coordination of Fe in the H-FeNC catalyst by comparison with Fe foil, Fe2O3, and FePc. Fig. 3a shows the Fe K-edge XANES spectra and the H-FeNC catalyst have similar near-edge absorption to Fe2O3, demonstrating that the valence state is close to +3. Based on the Fe K-edge derivative XANES spectra (Fig. 3b), the average oxidation state of Fe in H-FeNC catalyst is determined to be +2.9 (Fig. 3c). As shown in Fig. 3d, the Fourier transform of Fe k3-weighted EXAFS spectrum of H-FeNC catalyst shows a dominant peak at ~1.2 Å, assigning to the Fe-N coordination. And, there is no the Fe-Fe coordination in the H-FeNC catalyst, compared with a strong peak at ~2.2 Å for Fe foil. Furthermore, the wavelet transformed EXAFS spectra (Fig. 3e) indicate the characteristic signal of Fe-N bond. To determine the exact coordination chemistry of Fe site, the fitting analysis of EXAFS spectra (Fig. S9 in Supporting information) was carried out and the fitting parameters were listed in Table S2 (Supporting information). The H-FeNC catalyst has a Fe-N path for the first coordination shell with a coordination number of 4.4, suggesting the typical Fe-N4 configuration (Fig. S9c).
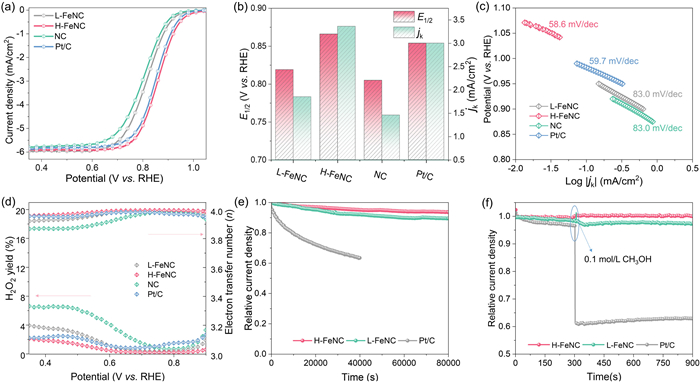
The electrochemical performances of the as-prepared carbon-based catalysts were evaluated in 0.1 mol/L KOH solution with the commercial 20 wt% Pt/C catalyst serving as a reference. To obtain the optimal H-FeNC catalyst, we discussed the concentrations of KOH solution (Fig. S10 in Supporting information), additions of EC600JD (Fig. S11 in Supporting information), pyrolysis temperatures (Fig. S12 in Supporting information), and pyrolysis times (Fig. S13 in Supporting information). As shown from the linear sweep voltammetry (LSV) curves in Fig. 4a, the half-wave potential (E1/2) of H-FeNC catalyst is located at ~0.866 V (vs. RHE), more positive than those of other as-prepared catalysts and Pt/C catalyst (~0.851 V) (Fig. 4b). For the N-doped EC600JD (NC), its ORR activity can be due to the formation of active N-functional groups on the surface of carbon black. Once Fe is introduced, the obtained L-FeNC catalyst with the E1/2 of 0.818 V shows an enhanced catalytic activity, which should benefit from the coordinated Fe-N4 active sites. Further by the deprotonation effect, the resulting H-FeNC catalyst with doubled Fe-N4 site exhibits the highest E1/2 and kinetic current density (jk) at 0.85 V, as shown in Fig. 4b. Meanwhile, such H-FeNC catalyst has a Tafel slope of 58.6 mV/dec, which is lower than other catalysts, indicating a faster ORR kinetic process occurred on H-FeNC catalyst (Fig. 4c). The selectivity of ORR path can be evaluated using the rotating ring disk electrode (RRDE) technique, and the test results of different catalysts (Fig. 4d) indicate that H-FeNC catalyst represents the lowest H2O2 yield of <2% and the highest electron transfer number (n) close to 4 according to Eqs. S2 and S3 (Supporting information). Fig. S14 (Supporting information) shows the ORR polarization curves of H-FeNC catalyst at different rotation speeds. Calculated from the Koutecký-Levich (K-L) equation (Eq. S1 in Supporting information), the average n value is 3.96 which also confirms the 4-electron transfer path. Furthermore, the KSCN poisoning tests were performed for H-FeNC catalyst (Fig. S15 in Supporting information). The results indicate that the catalytic activity of the H-FeNC catalyst gradually decreases as the KSCN concentration increases from 10 mmol/L to 50 mmol/L. This decline is attributed to the progressive poisoning of Fe-N4 active sites by SCN⁻ ions. Moreover, the amperometric current-time (i-t) technology was employed to evaluate the electrochemical stability (Fig. 4e) and methanol tolerance (Fig. 4f) of H-FeNC and L-FeNC catalysts. As shown in Fig. 4e, the H-FeNC and L-FeNC catalysts exhibit higher current retention of about 94% and 89% at a constant potential of 0.70 V (vs. RHE) after 80,000 s, respectively, compared to the Pt/C catalyst, which retains only ~63% of its initial current after 40,000 s. As illustrated in Fig. 4f, the current densities of the H-FeNC and L-FeNC catalysts remain nearly unchanged upon the introduction of 0.1 mol/L CH3OH into the electrolyte, whereas the Pt/C catalyst exhibits a sharp decline. Additionally, the H-FeNC shows higher catalytic activity than L-FeNC in 0.1 mol/L HClO4 electrolyte (Fig. S16 in Supporting information), although inferior to Pt/C. Electrochemical results suggest that the deprotonation effect-induced H-FeNC catalyst shows excellent catalytic ORR activity, electrochemical stability, and methanol tolerance.
Subsequently, the universality of the deprotonation effect on different non-noble carbon-based catalyst systems was verified (Fig. S17 in Supporting information). We performed the same experimental procedures for the synthesis of Fe-N-C catalysts by replacing PDA monomer with aniline (AN) and m-phenylenediamine (mPDA), respectively. Electrochemical results show that the E1/2 of H-FeNCPANI (0.798 V) is more positive about 13 mV than L-FeNCPANI (Fig. S17a). Meanwhile, H-FeNCPmPDA with an E1/2 of 0.847 V exhibits an improvement of 38 mV compared to that of L-FeNCPmPDA (Fig. S17b). XRD patterns (Fig. S18a in Supporting information) of H-FeNCPANI and H-FeNCPmPDA display that there are only two diffraction peaks of amorphous carbon. Also, XPS analysis was performed to identify the elemental compositions and the contents of different N-species. Fig. S18b (Supporting information) confirms the presence of C, N, O, and Fe elements in the H-FeNCPANI and H-FeNCPmPDA catalysts. The high-resolution N 1s XPS spectra of H-FeNCPANI (Fig. S18c in Supporting information) and H-FeNCPmPDA (Fig. S18d in Supporting information) show the various N-species, containing pyridinic-N, Fe-N, pyrrolic-N, graphitic-N, and oxidized-N. Among three Fe-N-C catalysts of H-FeNC, H-FeNCPmPDA, and H-FeNCPANI (Fig. S19 in Supporting information), the order of Total-N content is H-FeNC > H-FeNCPmPDA > H-FeNCPANI, which is directly related to the N-numbers in the precursor monomers of DAP, mPDA, and AN. Meanwhile, the pyridinic-N content maintains the same trend as the Total-N content. Expectantly, pyridinic-N can coordinate with Fe to form the Fe-N4 active sites. As a result, the H-FeNC catalyst has the highest Fe-N content, showing the best electrocatalytic ORR activity. Furthermore, the protonation effect was also evaluated in two similar systems of Co-N-C (L-CoNC and H—CoNC) and Cu-N-C (L-CuNC and H—CuNC) catalysts by replacing Fe in the Fe-N-C catalysts system with Co and Cu, respectively. The SEM-EDS results (Fig. S20 in Supporting information) indicated that the metal contents in H—CoNC (0.15 at%) and H—CuNC (0.19 at%) are higher than those of L-CoNC (0.05 at%) and L-CuNC (0.11 at%), respectively. Typically, H—CoNC shows a 30 mV increase in E1/2 compared to L-CoNC (Fig. S17c) and there is a 31 mV gap by comparison of L-CuNC and H—CuNC (Fig. S17d). Therefore, the proposed protonation effect in this work is a universal and effective synthesis strategy for improving the electrocatalytic ORR activity of single-atom catalysts.
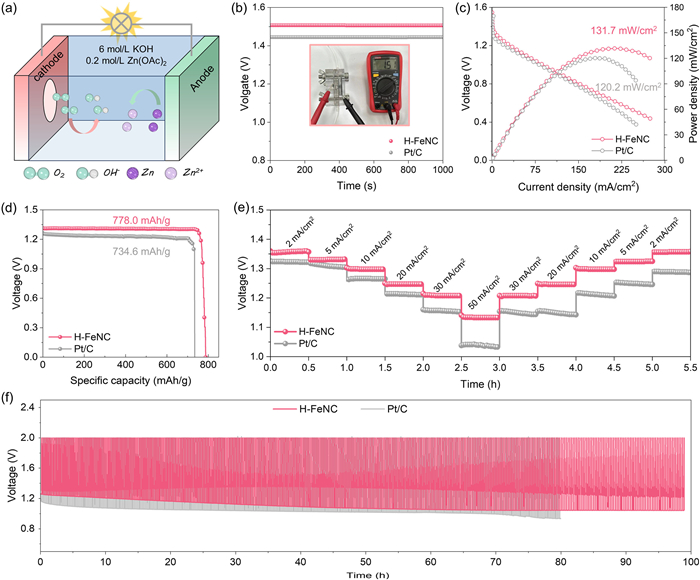
In view of the excellent electrocatalytic performance, H-FeNC was further evaluated as a cathodic catalyst in Zn–air batteries with commercial Pt/C for comparison. The schematic diagram of a Zn–air battery is depicted in Fig. 5a. The open-circuit voltage of H-FeNC is about 1.51 V (Fig. 5b), higher than that of Pt/C (1.44 V). Additionally, the Zn–air battery assembled with H-FeNC catalyst can offer a higher maximum power density of 131.7 mW/cm2 (Fig. 5c), exceeding the one constructed with Pt/C catalyst of 120.2 mW/cm2. Furthermore, Fig. 5d indicates that the discharge-specific capacity of H-FeNC at the current density of 10 mA/cm2 can be up to 778.0 mAh/g, higher than that of commercial Pt/C (~734.6 mAh/g). Meanwhile, such H-FeNC catalyst exhibits more excellent rate performance than Pt/C catalyst (Fig. 5e). Intriguingly, when the discharge current densities return to the same initial values, the output voltages of the H-FeNC based Zn–air battery can be well restored, whereas those of the Pt/C-based Zn–air battery have noticeable drops. Moreover, the cyclic stability test at 5 mA/cm2 (Fig. 5f) demonstrates that the H-FeNC-based Zn–air battery shows a stable discharge-charge potential gap without notable changes, while an obvious performance degradation for the commercial Pt/C battery. In recent years, non-precious Fe-based carbon catalysts have demonstrated outstanding performance as cathode materials in Zn–air batteries [50-58]. Table S3 (Supporting information) displays the Zn–air battery performance of the H-FeNC catalyst compared to previously reported Fe-based single-atom catalysts. These results highlight the promising potential of the H-FeNC catalyst as a highly efficient cathode material for Zn–air batteries.
In summary, we propose an effective strategy of deprotonation effect to realize the increase of Fe-N4 active site density in Fe-N-C catalyst. In this work, an oxidative polymerization of 2,6-diaminopyrodine monomers under the acidic solution leads to the formation of Fe-doped polymer, and a typical deprotonation process can proceed by the soaked treatment of polymer product with an alkaline solution. Theoretical calculations suggest that there is a distinct change in Gibbs free energy under the acidic and neutral/alkaline conditions for the coordination reaction of N-groups with Fe ions, and the deprotonation is conducive to this bonding process. As a result, the deprotonation effect doubles the number of Fe-N4 active sites in the high-temperature pyrolytic Fe-N-C catalyst, significantly improving the electrocatalytic ORR activity. In the Zn-air batteries, the optimal Fe-N-C with highly-dense Fe-N4 sites as a cathodic catalyst can achieve higher peak power density, discharge specific capacity, and rate performance compared to the commercial Pt/C. Also, this deprotonation strategy can be extended to the different polymer systems derived from the different amine-based precursors (e.g., aniline, m-phenylenediamine, and 2,6-diaminopyridine) and transition-metals (e.g., Fe, Co, and Cu). The deprotonation effect can be used as a universal strategy to increase the density of active sites for excellent oxygen reduction electrocatalysis.
The authors declare that they have no known competing financial interests or personal relationships that could have appeared to influence the work reported in this paper.
Zhili Yang: Writing – original draft, Investigation, Formal analysis, Data curation. Liqun Liu: Investigation, Formal analysis, Data curation. Xuebi Rao: Formal analysis, Data curation. Zeyu Jin: Formal analysis. Jialin Sun: Formal analysis. Yongkang Zhu: Formal analysis. Shiming Zhang: Writing – review & editing, Supervision, Funding acquisition, Conceptualization.
This work was sponsored by the National Natural Science Foundation of China (No. 22272105) and the Natural Science Foundation of Shanghai (No. 23ZR1423900). The authors would like to thank Shiyanjia Lab (
Supplementary material associated with this article can be found, in the online version, at doi:
Z.P. Cano, D. Banham, S. Ye, et al., Nat. Energy 3 (2018) 279–289. doi: 10.1038/s41560-018-0108-1
S. Zhang, M. Chen, X. Zhao, et al., Electrochem. Energy Rev. 4 (2021) 336–381. doi: 10.1007/s41918-020-00085-0
M. Li, X. Bi, R. Wang, et al., Matter 2 (2020) 32–49. doi: 10.1016/j.matt.2019.10.007
C. Yuan, S. Zhang, J. Zhang, Front. Energy 18 (2024) 206–222. doi: 10.1007/s11708-023-0907-3
Y. Nie, L. Li, Z. Wei, Chem. Soc. Rev. 44 (2015) 2168–2201. doi: 10.1039/C4CS00484A
Y. Chen, S. Zhang, J.C.Y. Jung, J. Zhang, Energy Combust. Sci. 98 (2023) 101101. doi: 10.1016/j.pecs.2023.101101
A. Sarapuu, J. Lilloja, S. Akula, et al., ChemCatChem 15 (2023) e202300849. doi: 10.1002/cctc.202300849
X. Lu, P. Yang, Y. Wan, et al., Coord. Chem. Rev. 495 (2023) 215400. doi: 10.1016/j.ccr.2023.215400
Z. Yang, Y. Chen, S. Zhang, J. Zhang, Adv. Funct. Mater. 33 (2023) 2215185. doi: 10.1002/adfm.202215185
X. Rao, S. Zhang, J. Zhang, Curr. Opin. Electrochem. 42 (2023) 101416. doi: 10.1016/j.coelec.2023.101416
K. Liu, J. Fu, Y. Lin, et al., Nat. Commun. 13 (2022) 2075. doi: 10.1038/s41467-022-29797-1
Q. Jia, E. Liu, L. Jiao, S. Pann, S. Mukerjee, Adv. Mater. 31 (2019) 1805157. doi: 10.1002/adma.201805157
P. Chen, T. Zhou, L. Xing, et al., Angew. Chem. Int. Ed. 129 (2017) 625–629. doi: 10.1002/ange.201610119
Q. Li, W. Chen, H. Xiao, et al., Adv. Mater. 30 (2018) 1800588. doi: 10.1002/adma.201800588
J. Liu, W. Chen, S. Yuan, T. Liu, Q. Wang, Energy Environ. Sci. 17 (2024) 249–259. doi: 10.1039/D3EE03183G
J. Roh, A. Cho, S. Kim, et al., ACS Catal. 13 (2023) 9427–9441. doi: 10.1021/acscatal.3c01136
A.G. Saputro, A.K. Fajrial, A.L. Maulana, et al., J. Phys. Chem. C 124 (2020) 11383–11391. doi: 10.1021/acs.jpcc.0c00632
T. Wu, Y. Wang, H. Zhao, J. Dong, J. Xu, J. Colloid Interface Sci. 603 (2021) 706–715. doi: 10.1016/j.jcis.2021.06.116
Y. Yang, H. Zhang, Z. Liang, et al., J. Energy Chem. 44 (2020) 131–137. doi: 10.1016/j.jechem.2019.08.009
W. Song, C. Xiao, J. Ding, et al., Adv. Mater. 36 (2023) 2301477. doi: 10.1002/adma.202301477
M. Wang, L. Wang, Q. Li, et al., Small 19 (2023) 2300373. doi: 10.1002/smll.202300373
Y. Zhang, J. Yang, R. Ge, et al., Coord. Chem. Rev. 461 (2022) 214493. doi: 10.1016/j.ccr.2022.214493
G. Chen, R. Lu, C. Li, et al., Adv. Mater. 35 (2023) 2300907. doi: 10.1002/adma.202300907
J. Yang, Z. Wang, C. Huang, et al., Angew. Chem. Int. Ed. 60 (2021) 22722–22728. doi: 10.1002/anie.202109058
M. Chen, J. Chen, C. Jia, et al., Cell Rep. Phys. Sci. 4 (2023) 101204. doi: 10.1016/j.xcrp.2022.101204
P. Yang, J. Li, D.G. Vlachos, S. Caratzoulas, Angew. Chem. Int. Ed. 63 (2023) e202311174. doi: 10.1002/anie.202311174
S.Y. Yi, E. Choi, H.Y. Jang, et al., Adv. Mater. 35 (2023) 2302666. doi: 10.1002/adma.202302666
R. Jiang, Z. Qiao, H. Xu, D. Cao, Chin. J. Catal. 48 (2023) 224–234. doi: 10.1016/S1872-2067(23)64419-5
S. Huang, Z. Qiao, P. Sun, et al., Appl. Catal. B 317 (2022) 121770. doi: 10.1016/j.apcatb.2022.121770
Z. Fan, H. Wan, H. Yu, J. Ge, Chin. J. Catal. 54 (2023) 56–87. doi: 10.1016/S1872-2067(23)64538-3
C. Brea, G. Hu, ACS Catal. 13 (2023) 4992. doi: 10.1021/acscatal.3c00090
P. Zhu, X. Xiong, X. Wang, et al., Nano Lett. 22 (2022) 9507–9515. doi: 10.1021/acs.nanolett.2c03623
X. Shu, D. Tan, Y. Wang, J. Ma, J. Zhang, Angew. Chem. Int. Ed. 136 (2024) e202316005. doi: 10.1002/anie.202316005
L. Liu, A. Corma, Chem. Rev. 123 (2023) 4855. doi: 10.1021/acs.chemrev.2c00733
L. Liu, X. Rao, S. Zhang, J. Zhang, Chem 10 (2024) 1994–2030. doi: 10.1016/j.chempr.2024.06.006
K. Kumar, L. Dubau, F. Jaouen, F. Maillard, Chem. Rev. 123 (2023) 9265–9326. doi: 10.1021/acs.chemrev.2c00685
H.M. Xu, H.R. Zhu, C.J. Huang, et al., Sci. China: Chem. 67 (2024) 1137–1160. doi: 10.1007/s11426-023-1863-8
S. Yin, H. Yi, M. Liu, et al., Nat. Commun. 15 (2024) 6229. doi: 10.1038/s41467-024-50629-x
G. Wu, K.L. More, C.M. Johnston, P. Zelenay, Science 332 (2011) 443–447. doi: 10.1126/science.1200832
H.T. Chung, D.A. Cullen, D. Higgins, et al., Science 357 (2017) 479–484. doi: 10.1126/science.aan2255
Q. Wang, Z.Y. Zhou, Y.J. Lai, et al., J. Am. Chem. Soc. 136 (2014) 10882–10885. doi: 10.1021/ja505777v
Y.C. Wang, Y. Lai, L. Song, et al., Angew. Chem. Int. Ed. 127 (2015) 10045–10048. doi: 10.1002/ange.201503159
G. Chen, P. Liu, Z. Liao, et al., Adv. Mater. 32 (2020) 1907399. doi: 10.1002/adma.201907399
G. Chen, Y. An, S. Liu, et al., Energy Environ. Sci. 15 (2022) 2619–2628. doi: 10.1039/d2ee00542e
J. Herranz, F. Jaouen, M. Lefèvre, et al., J. Phys. Chem. C 115 (2011) 16087–16097. doi: 10.1021/jp2042526
Y. Irmawati, B. Prakoso, F. Balqis, et al., Energy Fuels 37 (2023) 4858–4877. doi: 10.1021/acs.energyfuels.2c04272
B. Shi, H. Li, X. Fu, et al., Purif. Technol. 335 (2024) 125866. doi: 10.1016/j.seppur.2023.125866
J. Wang, B. Deng, H. Chen, X. Wang, J. Zheng, Environ. Sci. Technol. 43 (2009) 5223–5228. doi: 10.1021/es803710k
E.T. Kang, K.G. Neoh, K.L. Tan, Prog. Polym. Sci. 23 (1998) 277–324. doi: 10.1016/S0079-6700(97)00030-0
H. Jin, R. Yu, P. Ji, et al., Chem. Sci. 15 (2024) 7259–7268. doi: 10.1039/d4sc01329h
X. Wang, L. Zhang, M. Xiao, et al., Chin. Chem. Lett. 34 (2023) 107455. doi: 10.1016/j.cclet.2022.04.053
T. Yang, Y. Chen, Y. Liu, X. Liu, S. Gao, Chin. Chem. Lett. 33 (2022) 2171–2177. doi: 10.1016/j.cclet.2021.09.014
S. He, J. Wang, C. Sun, J. Colloid Interface Sci. 677 (2025) 771–780. doi: 10.1016/j.jcis.2024.08.020
J. Wei, J. Wang, W. Zhang, Y, Mao, C. Sun, Chem. Eur. J. 31 (2025) e202403445. doi: 10.1002/chem.202403445
J. Han, H. Bao, J.Q. Wang, et al., Appl. Catal. B 280 (2021) 119411. doi: 10.1016/j.apcatb.2020.119411
J. Han, J. Bian, C. Sun, Research 2020 (2020) 9512763. doi: 10.34133/2020/9512763
J. Han, X. Meng, L. Lu, et al., Adv. Funct. Mater. 29 (2019) 1808872. doi: 10.1002/adfm.201808872
H. Jin, X. Zhao, L. Liang, et al., Small 17 (2021) 2101001. doi: 10.1002/smll.202101001

Figure 1 (a) The proposed deprotonation process and three local configurations represented as Model_1, Model_2, and Model_3. (b) The changes in Gibbs free energy of two different coordination reactions at pH 0 and 7, respectively.

Figure 2 (a) TEM image, and (b) HAADF-STEM image and corresponding elemental mapping images of the H-FeNC catalyst. The high-resolution AC—HAADF-STEM images of (c) L-FeNC and (d) H-FeNC catalysts. (e) High-resolution XPS spectra of N 1s for H-FeNC and L-FeNC.

Figure 3 (a) Fe K-edge XANES spectra, (b) Fe K-edge derivative XANES spectra, (c) the corresponding average oxidation states of Fe center, (d) Fourier transform EXAFS spectra, and (e) wavelet transformed EXAFS contour plot for Fe foil, Fe2O3, H-FeNC, and FePc.

Figure 4 (a) ORR polarization curves, (b) the values of half-wave potential and kinetic current density at 0.85 V (vs. RHE), (c) Tafel plots and slopes, and (d) electron transfer number (n) and H2O2 yield (H2O2%) for the prepared catalysts and commercial 20% Pt/C catalyst in 0.1 mol/L KOH solution. (e) Electrochemical stability tests and (f) methanol tolerance experiments with the addition of 0.1 mol/L CH3OH for H-FeNC and L-FeNC compared with 20% Pt/C by the amperometric i-t method at a constant potential of 0.70 V (vs. RHE) in 0.1 mol/L KOH solution.

Figure 5 (a) Schematic diagram of a Zn–air battery. (b) Open-circuit voltages (inset shows a multimeter test of open-circuit voltage of H-FeNC catalyst. (c) Polarization curves and power density curves. (d) Discharge specific capacities at the current density of 10 mA/cm2. (e) Rate performance curves at different discharge current densities of Zn–air batteries with H-FeNC and Pt/C catalysts, respectively, and (f) cyclic stability test of H-FeNC and Pt/C-based Zn-air battery at 5 mA/cm2.

 扫一扫看文章

扫一扫关注我们
 DownLoad:

 下载:
下载:
 下载:
下载: