Figure 1.
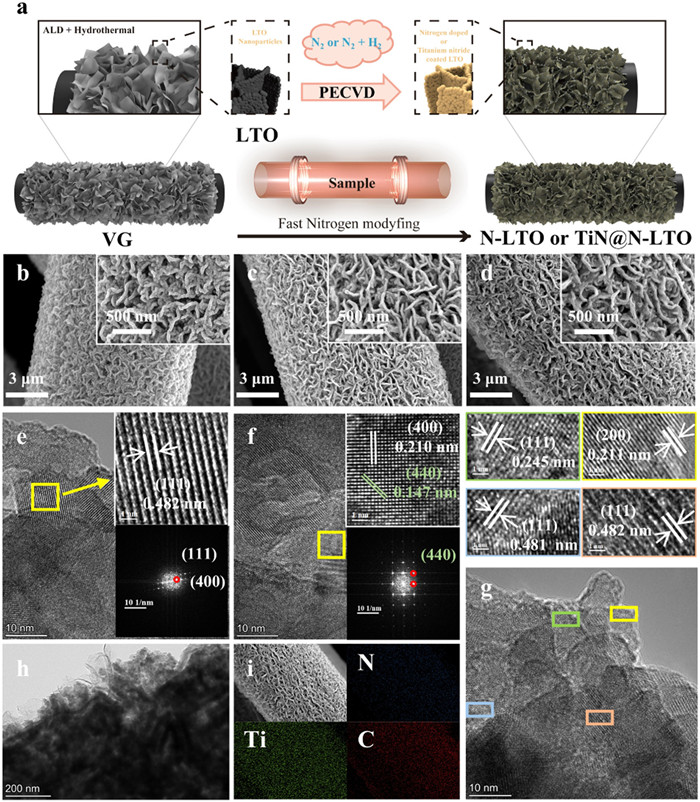
Synthesis and characterization. (a) Fabrication schematics. SEM images and TEM images of (b, e, h) LTO array, (c, f) N-LTO array, and (d, g) TiN@N-LTO array. (i) EDS mapping of TiN@N-LTO.
Rational synthesis of vertical graphene supported TiN@N-Li4Ti5O12 as advanced high-rate electrodes for lithium-ion batteries
Chong Tang , Zhong Qiu , Chen Li , Tengfei Zhang , Renhong Chen , Yifa Sheng , Xinhui Xia , Yongqi Zhang , Jun Liu

The rapid development of mobile electronics, electric vehicles and grid-scale energy storage has resulted in a significant increase in demand for energy storage devices [1-5]. Lithium ion batteries (LIBs) as the promising candidate have been widely studied and applied to various scenarios to adapt different requirements [6-10]. High-power density has been one of key parameters for LIBs to meet the fast-pace society [11]. Among the various anode materials, spinel lithium titanate (Li4Ti5O12, LTO) is regarded as a particularly promising candidate due to its zero-strain characteristics during the Li+ insertion/extraction process [12]. Moreover, the relatively high charge/discharge plateau (1.5 V vs. Li/Li+) inhibits the formation of Li dendrites and the solid electrolyte interphase [13,14], which can give rise to safety hazards and a deterioration in electrochemical performance. However, the low electronic conductivity of LTO, which is approximately lower than 10−13 cm2/s with a bandgap energy of 2–3 eV, and the moderate Li+ diffusion coefficient (10−10–10−13 cm2/s) in the LTO presents a significant challenge in meeting the high power requirement [15]. Therefore, it is necessary to implement appropriate modification strategies to improve the performance of LTO.
Morphology engineering has been widely regarded as a conventional and efficacious approach to reducing the transfer distance of ions and electrons in an electrochemical reaction by increasing the specific surface area [16,17]. Over the past few decades, numerous nanostructured LTOs, including nanoparticles, nanosheets, and nanospheres, have been successfully fabricated and reported to enhance their rate performance. To further enhance the conductivity of LTO-based electrodes, compositing LTO with conducting scaffolds, such as graphene [18-21], carbon nanotubes (CNTs) [22], 3D metals [23], and so forth, is a promising approach. In particular, self-standing scaffolds can circumvent the necessity for organic binders and facilitate superior Li+ and electron transport pathways at the electrolyte/LTO and LTO/current collector interfaces, respectively. For instance, the integration of conductive TiC/C nanowire arrays with LTO has demonstrated an exceptional high-rate capability (143 mAh/g at 10 C) [24]. Taken the overall energy density into consideration, carbon-based scaffolds, such as VG and CNTs are the best choices attributing to their light weight, superior conductivity and large specific surface area. In addition to the conductive scaffolds, decorating the LTO surface with conductive materials has also been demonstrated to improve its conductivity. The synthesis of nano-carbon-nitrogen modified LTO composites with their surface adhering carbon-nitrogen quantum dots has been successfully achieved. The modified LTO has been observed to deliver as high as 156.5 and 140.4 mAh/g at 20 and 40 C, respectively.
Nevertheless, it is not feasible to significantly enhance the intrinsic conductivity of LTO through physical strategies. Chemical strategies for LTO remain a key area of focus, given that the inner transfer characteristics of ions and electrons in LTO remain relatively low. One of the most effective methods for enhancing the intrinsic conductivity of LTO is heteroatom doping, such as nitrogen doping. This may introduce defects into LTO, reduce the bandgap and expand the diffusion pathways of ions. A variety of nitrogen doping methods for LTO have been developed to date, including the hydrothermal method [25], thermal decomposition of nitro-organic compounds and annealing LTO in ambient ammonia [26]. However, these approaches are not without significant limitations, including the use of toxic and environmentally unfriendly nitrogen sources, high temperatures, and lengthy treatment times. Recently, N2 plasma has been developed as a feasible tool for introducing N heteroatoms and nitridation under relatively low temperatures and short durations [27]. In this regard, modification of LTO under N2 plasma is a particularly promising avenue of research.
In this study, LTO was loaded on VG arrays by atomic layer deposition (ALD) and hydrothermal method. The 3D porous morphology and superior electron conductivity of the VG scaffold facilitate the transfer of lithium ions and electrons. Furthermore, the thickness of the LTO can be precisely regulated with atomic layer deposition (ALD) technology. Subsequently, the LTO samples are subjected to a treatment under N2 and H2 plasma at 100 ℃ for a period of 3 min. During the plasma treatment process, a substantial number of nitrogen heteroatoms are introduced into the LTO. Concurrently, a small number of metallic TiN are formed and deposited on the surface of N-LTO, resulting in the formation of TiN@N-LTO. COMSOL simulations and DFT calculations demonstrate that the introduction of TiN improves the charge distribution of LTO electrodes and enhances the Li+ transport rate. Consequently, the TiN@N-LTO displays enhanced high-rate capacity (101.08 mAh/g at 20 C) and remarkable long-term cycling stability (capacity retention of 99.6% after 5000 cycles at 10 C). Our work provides new insights into the design and construction of high-power anodes for fast energy storage and conversion.
Fig. 1a provides an illustration of the fabrication schemes. The initial stage of the process involved the growth of a highly conductive VG array on a carbon cloth substrate via plasma-enhanced chemical vapor deposition (PECVD). As illustrated in Fig. S1a (Supporting information), the vertical-aligned nano-walls are interconnected to form a network that facilitates rapid electron and ion transfer. The interstitial spaces between the nano-walls can accommodate the subsequent LTO deposition. From the cross-sectional image, it can be observed that the thickness of the VG array is approximately 4 μm (Fig. S1b in Supporting information). Four peaks were identified in the Raman spectrum (Fig. S2 in Supporting information), located at 1341, 1577, 2662 and 2918 cm−1, which correspond to the D, G, 2D and 2 G peaks, respectively. As illustrated in Fig. S3a (Supporting information), the transmission electron microscope (TEM) image reveals the nano-morphology, which exhibits a characteristic lattice fringe corresponding to the (002) crystal plane of graphite with a lattice spacing of 0.34 nm (Fig. S3b in Supporting information) [28]. Following an atomic layer deposition (ALD)-assisted hydrothermal process, the LTO particles were successfully anchored to the surface of the VG nanosheets (Figs. 1b and h). The TEM image (Fig. S4a in Supporting information) demonstrates that the particle size of LTO is 20–30 nm. In comparison to their bulk counterparts, LTO nanoparticles facilitate the reduction of the ions/electrons transport path, thereby accelerating the reaction kinetics. Furthermore, the high-resolution TEM images in Fig. 1e reveal the presence of a lattice fringe with a spacing of 0.482 nm, which can be attributed to the (111) crystal plane of LTO (JCPDS No. 49–0207). And the selected area electron diffraction image corroborates the (111) crystal plane and elucidates the single-crystal character of the fabricated LTO nanoparticles. Subsequently, the VG-supported LTO array was modified using N2 or N2/H2 hybrid plasma technology to produce N-LTO and TiN@N-LTO, respectively. The SEM image shows the identical structure observed in LTO in Figs. 1c and d, demonstrating robust adhesion between the VG array and the LTO particles. The high-resolution TEM image (Fig. 1f) demonstrates the lattice fringe of (400) and (440), which correspond to LTO [29]. Interestingly, it is noteworthy that when the VG-supported LTO was exposed to a N2 and H2 hybrid plasma, a thin layer of TiN was observed to decorate the surface of the N-LTO particles, as evidenced by the TEM image in Fig. 1g. Two distinctive lattice fringes, attributed to the (111) and (200) crystal planes, are discernible in the surrounding region. These align with the TiN phase (JCPDS No. 38–1420), as evidenced by the corresponding references. The crystal fringe within the particle exhibits a spacing of approximately 0.48 nm, which is attributed to the (111) crystal planes of LTO. Energy dispersive spectroscopy mapping images demonstrate a uniform distribution of N, Ti, and C elements along with the carbon fiber in Fig. 1i, indicating the successful doping of N. This phenomenon can be attributed to the enhanced reduction property resulting from the introduction of H2. Consequently, after N2 and H2 (6:1) plasma treatment, TiN-decorated N-LTO was constructed to enhance its electrochemical performance [30].
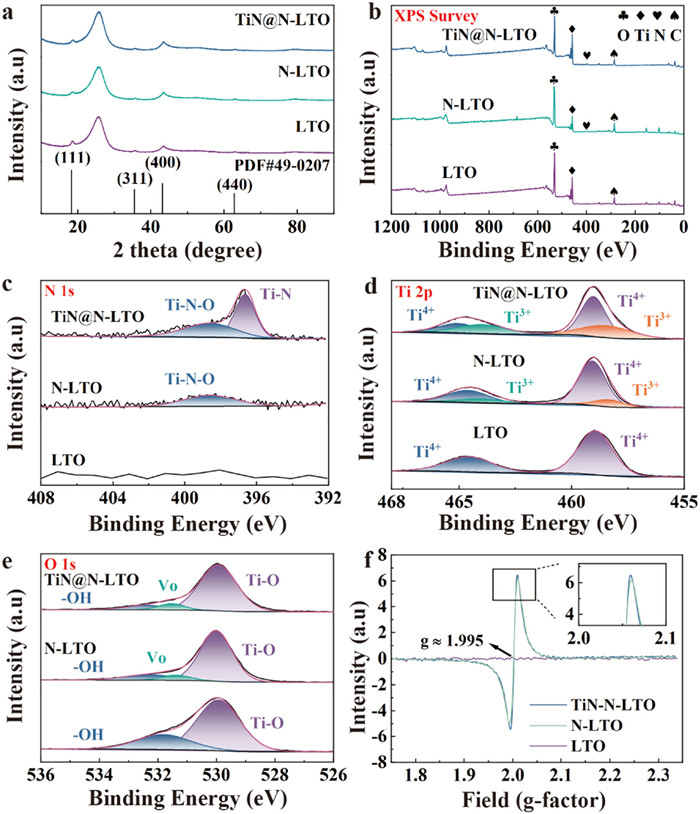
Furthermore, the crystalline phase of the LTO before and after plasma treatment was also determined by X-ray diffraction patterns, as illustrated in Fig. 2a. With the exception of the peaks at 25.9° and 43.5°, which correspond to the (002) and (100) planes of carbon [31]. The remaining four peaks were observed at 18.3°, 35.5°, 43.2° and 62.8°, which can be well matched with (111), (311), (400) and (440) planes of the spinel LTO (JCPDS No. 49–0207), indicating the successful fabrication of LTO. In the case of the samples subjected to plasma treatment, four distinctive peaks were identified, with no evidence of the presence of impurity peaks. X-ray photoelectron spectroscopy (XPS) was employed to gain further insight into the chemical composition and the bonding structure between the dopant and LTO. An XPS survey scan of plasma-treated LTO unambiguously reveals the characteristic peaks for N (~400 eV), Ti (~460 eV) and O (~530 eV), as illustrated in Fig. 2b. The quantitative analysis results from the XPS survey indicate that the amount of N in TiN@N-LTO is approximately 1.44 at%, which is significantly higher than that of N-LTO (0.45 at%) with only N2 as the plasma precursor. This suggests that H2 can markedly enhance the reactivity of N2 plasma, leading to an increased doping content. In the N 1s spectrum (Fig. 2c), a peak at 398.6 eV in N-LTO can be attributed to O-Ti-N. For the TiN@N-LTO, except for the peak belonging to O-Ti-N, there is another peak at 396.4 eV attributed to Ti-N bond, reconfirming the existence of TiN. The Ti 2p spectrum (Fig. 2d) exhibits two prominent double peaks at 464.5 and 458.5 eV, which correspond to the Ti4+ 2p3/2 and Ti4+ 2p1/2 orbitals, respectively. It is noteworthy that the Ti3+ peaks observed at a lower bonding energy following plasma treatment can be attributed to the Ti-N bond, as previously reported in the literature [32]. The O 1s spectra (Fig. 2e) of TiN@N-LTO and N-LTO can be deconvoluted into three peaks at 530, 531.5 and 532.1 eV, which can be assigned to Ti-O, oxygen vacancies and hydroxyl oxygen, respectively. For comparison, the O 1s of the bare LTO sample is composed of two peaks, lacking the characteristic peak corresponding to oxygen vacancies. Furthermore, the presence of oxygen vacancies following plasma treatment is corroborated by the electron paramagnetic resonance (EPR) analysis illustrated in Fig. 2f. The EPR signal peaks at g = 1.995 are clearly discernible in the spectra of TiN@N-LTO and N-LTO, whereas no such characteristic peak is observed in the spectrum of bare LTO. Furthermore, the peak intensity of TiN@N-LTO is slightly higher than that of N-LTO. These findings provide convincing evidence that at 13.56 MHz, the N2 and H2 are ionized to be plasma, in which they are presented in active radicals, such as NH, N2, N and H. Under plasma state, these radicals are highly active to boom the LTO to break the Ti-O bond. Then, N radicals could replace O to form TiN. This process can be enhanced through the introduction of H2 plasma [33].
To gain insight into the lithium diffusion kinetics of the TiN@N-LTO electrode, a series of electrochemical measurements were conducted. The rate of electrochemical reactions occurring during the charging and discharging processes is dependent upon the diffusion of Li+ and the transfer of electrons. Cyclic voltammetry (CV) measurements (Fig. 3a) were employed for the study of the Li+ insertion and extraction reactions. For these electrodes, a single pair of redox peaks is observed, corresponding to the phase transformation between Li4Ti5O12 and Li7Ti5O12 [34]. It is noteworthy that the voltage gap (0.096 V) of TiN@N-LTO and the peak current density (0.425 mA/mg) are both better than those of N-LTO (0.166 V, 0.401 mA/mg) and LTO (0.169 V, 0.359 mA/mg). This indicates that the introduction of TiN and N doping can effectively mitigate the polarization phenomenon. To gain further insight into the dynamic properties of electronic transport, the electrochemical impedance spectroscopy (EIS) results for the three samples were compared in Fig. 3b. The semicircle observed at medium frequencies, represented as the interfacial charge-transfer resistance (Rct), is attributed to the kinetics of the electrochemical reactions. The slope line at low frequency is related to the transfer rate of Li+. The Rct of TiN@N-LTO electrodes is 47.6 Ω, which is lower than that of N-LTO (58.4 Ω) and LTO electrodes (181.8 Ω). This indicates that nitrogen treatment can optimize the electrochemical process, and the introduction of hydrogen can further optimize the process. Furthermore, the slope angle of TiN@N-LTO in the low-frequency region is greater than that of LTO, indicating that ion diffusion is more rapid.
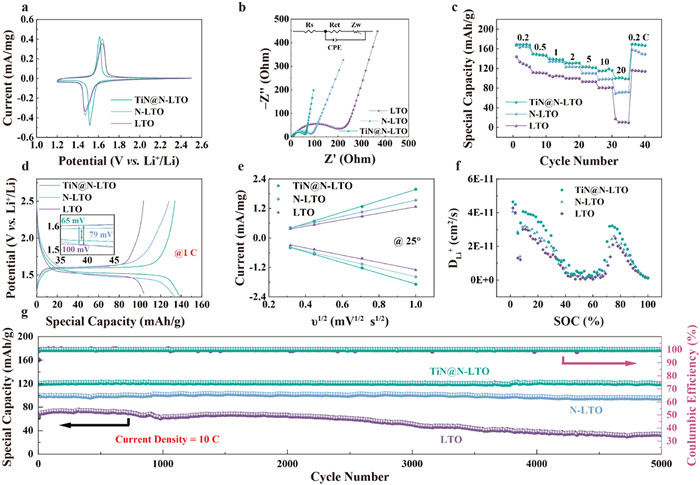
Further evidence for the fast-charging capability of the TiN@N-LTO electrode in the current density range from 0.1 C to 20 C is presented in Fig. S5 (Supporting information). It can be observed that TiN@N-LTO electrodes exhibit higher discharge capacity and lower charge flat plateau. Furthermore, the charge/discharge curves at 1 C of all electrodes exhibit a flat plateau at approximately 1.55 V, which aligns with the results of the cyclic voltammetry (CV) experiment. The specific capacities of the TiN@N-LTO electrodes at 0.2, 2 and 20 C are 169.51, 131.61 and 101.08 mAh/g, respectively (Fig. 3c). These values are considerably higher than those observed for the N-LTO electrodes (167.21, 123.43 and 72.06 mAh/g at the same rates) and LTO electrodes (115.35, 100.04 and 10.68 mAh/g at the same rates). This is due to the fact that nitrogen doping and TiN modification can construct fast and stable Li+ transport channels, thus optimising the Li+ kinetics. To facilitate a more intuitive comparison of the polarization phenomenon, the charge-discharge curve at 1 C was examined. As illustrated in Fig. 3d, the TiN@N-LTO electrodes exhibit a lower polarization (65 mV) compared to N-LTO (79 mV) and LTO (100 mV), which aligns with the findings of the CV analysis. These findings demonstrate that the TiN and nitrogen doping can optimize the electrode's polarization phenomenon and accelerate the electrochemical kinetics [35].
To further substantiate the assertion that the TiN itself can confer enhanced electrical and ionic conductivity to LTO, a series of electrochemical tests were conducted on the TiN, including a cyclic voltammetry (CV) test at various scan rates and a galvanostatic intermittent titration technique (GITT) test on three electrodes [36]. A comparison of the relationship between peak current and the square root of the scan rate (Fig. S6 in Supporting information) reveals that the slope of TiN@N-LTO is greater than that of the other electrodes in Fig. 3e, indicating that TiN@N-LTO exhibits faster diffusion and higher electrode reactivity. As illustrated in Fig. S7 (Supporting information), the specific capacity of the TiN electrode in the charge/discharge interval of LTO is nearly negligible, indicating that TiN has no effect on the capacity of LTO itself. However, it does improve the electrochemical performance of LTO by other means. A comparison of the DLi+ at different states of charge during the discharge process reveals that the DLi+ of the TiN@N-LTO electrode is significantly higher than that of the other two electrodes (Fig. 3f). Furthermore, a comparison of the DLi+ at varying voltages during the discharge process (Fig. S8a in Supporting information) yields analogous results. The combination of the two results demonstrates that TiN serves an auxiliary role in TiN@N-LTO, covering the surface of LTO and laterally establishing a faster lithium-ion transport channel for LTO, thereby enhancing conductivity. On this basis, the diffusion coefficient D (cm2/s) of Li+ in both electrodes was calculated using the following equation:
|
|
(1) |
where A, C, n, and V represent the surface area of the electrode, concentration of Li+, the number of transferred electrons per molecule and scan rate, respectively. The TiN@N-LTO electrodes show the highest diffusion coefficient (2.14 × 10⁻⁸ cm2/s), surpassing that of N-LTO (1.37 × 10⁻⁸ cm2/s) and LTO electrodes (1.03 × 10⁻⁸ cm2/s). In view of the necessity for the cycle life of LiBs, the cycling performances of the various anode electrodes are estimated (Fig. 3g). The TiN@N-LTO electrode exhibits the most superior cyclic stability, with a capacity retention of 99.6% (120.44 mAh/g, 120.96 mAh/g) at 10 C and a nearly 100% Coulombic efficiency after 5000 cycles. This performance is superior to that of the N-LTO electrodes, which exhibit a capacity retention of 95.52% (95.37 mAh/g), and the LTO electrodes, which demonstrate a capacity retention of only 53.11% (33.54 mAh/g). The exceptional longevity of TiN@N-LTO electrodes can be attributed to two principal factors. Primarily, the doping of nitrogen into the material enhances the electrochemical activity, as evidenced by previous studies [37]. Secondly, the formation of TiN improves both the conductivity and structural stability of the electrodes.
The TiN@N-LTO electrode displays the most remarkable electrochemical performance, which can be ascribed to the following factors: (1) Nitrogen doping has been successfully introduced into the LTO lattice, replacing the oxygen atoms, thereby regulating the electron cloud density and distribution and optimizing the reaction kinetics of Li+. (2) The exceptional metal conductivity and structural stability of TiN facilitate the optimization of Li-ion conductivity in the electrode. (3) The TiN decorating the N-LTO surface serves to mitigate the uneven charge distribution associated with nitrogen doping, enhancing the cycle life for the electrode.
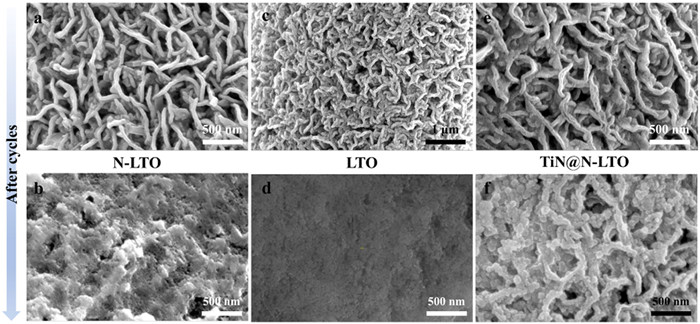
To verify the enhancement of LTO stability following PECVD N-modification, we captured SEM images both before and after rate cycling and long cycling processes (Fig. 4). Following the cycling process, the structure of the LTO electrode underwent a collapse (Fig. 4d), whereas the surfaces of the two modified electrodes largely retained their original structural integrity. In comparison to the N-LTO electrodes, which demonstrate a somewhat diminished degree of structural collapse following cycling (Fig. 4b), the TiN@N-LTO electrodes exhibit a superior capacity to maintain the original morphology after cycling (Fig. 4f). This finding supports the hypothesis that while N doping enhances electrochemical performance, it offers only a modest improvement in structural stability. The uniform charge distribution produced by TiN can assist in maintaining the structural stability and cycle life of LTO.
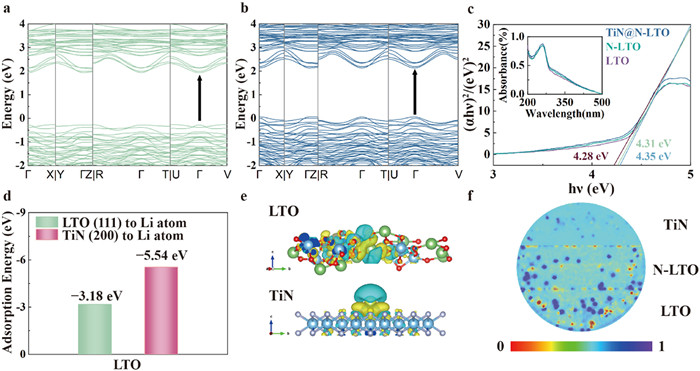
To study the effects of N-doping and TiN on the electronic properties of LTO, DFT calculation was conduted to calculate the band gap of LTO, N-doped LTO and TiN and the detail the band structures are shown in Fig. 5. The band gap of N-doped LTO is 2.0715 eV lower than that of LTO (2.2069 eV). Fig. S9 (Supporting information) shows that the TiN system exhibits an overlap between the conduction and valence bands, showing its metallic feature, which were further supported by the UV–vis in Fig. 5c. The UV–vis absorption spectra show that TiN@N-LTO has the lowest band gap, further certificating that the introduction of TiN improves the conductivity. Consequently, N-doping and TiN can enhance the conductivity of LTO arrays after plasma modification. Besides, the adsorption energies between Li and electrode materials were also calculated to further understand the interaction mechanism of lithium adsorption on the electrode surface according to the TEM images in Fig. 1j. The (111) plane of LTO and the (200) plane of TiN were selected to calculate the adsorption energy, the results (Fig. 5d) indicate that the more stable adsorption site of Li atoms on the (111) plane of LTO and the (200) plane of TiN have adsorption energies of −3.18 and −5.54 eV, respectively. The lower adsorption energy on the TiN surface facilitates Li+ insertion and migration. The charge density difference analysis (Fig. 5e) indicates that the Li ion accumulation phenomenon is more pronounced on the TiN surface. The conjunction of these two outcomes indicates that TiN can attract a greater quantity of Li+ for LTO. To further illustrate the impact of TiN on LTO, COMSOL Multiphysics simulation was performed to analyze the charge distribution and Li+ accumulation phenomenon of different materials. As illustrated in Fig. 5f, three regions on a single electrode were constructed. The findings demonstrate that TiN exhibits the most uniform charge distribution. Based on above-mentioned results, it can be summarized as follows: (1) Nitrogen doping can reduce the bandgap and improve the local charge distribution of LTO to some extent; (2) TiN significantly make the charge distribution of LTO uniform and improve the adsorption of LTO, which promote a fast insertion and migration of Li+ ion; and (3) it is the synergistic effect of N doping and TiN layer to improve the electronic conductivity and structure stability of electrode boosting the enhanced electrochemical performance.
In conclusion, we demonstrated a powerful plasma method to construct the self-supported N-LTO on self-supported VG arrays with metallic TiN decorated on their surface. The conductivity of the obtained electrode material was improved in both intrinsic (N doping) and extrinsic aspects (self-supported porous morphology, conductive VG scaffold and metallic TiN phase). In addition, COMSOL simulations and DFT calculations show that the N dopant and metallic TiN optimize the kinetic reaction of Li+ and regulate the migration process of Li+ in LTO, which enhances the electrochemical activity and cycling performance to achieve high performance. As a result, the TiN@N-LTO delivers a discharge capacity of 101.08 mAh/g at 20 C and achieves a capacity retention of 99.6% after 5000 cycles. This approach paves the way for the development of high-performance electrode materials with enhanced intrinsic ion/electron conductivity and structural stability.
The authors declare that they have no known competing financial interests or personal relationships that could have appeared to influence the work reported in this paper.
Chong Tang: Writing – review & editing, Writing – original draft, Data curation. Zhong Qiu: Writing – review & editing. Chen Li: Supervision. Tengfei Zhang: Supervision. Renhong Chen: Supervision. Yifa Sheng: Funding acquisition. Xinhui Xia: Writing – review & editing. Yongqi Zhang: Writing – review & editing. Jun Liu: Writing – review & editing.
This work is supported by the Hunan Provincial Natural Science Foundation of China (No. 2023JJ30499), the Guangdong Provincial Natural Science Foundation of China (No. 2022A1515010198), the National Natural Science Foundation of China (No. 52073252), the Science and Technology Department of Zhejiang Province (No. 2023C01231), the Key Research and Development Project of the Science and Technology Department of Sichuan Province (No. 2022YFSY0004), the Key Laboratory of Engineering Dielectrics and Its Application (Harbin University of Science and Technology), Ministry of Education (No. KFM 202202), the Open Project Program of the State Key Laboratory of Photocatalysis on Energy and Environment (No. SKLPEE-KF202206), Fuzhou University. The authors appreciate Tingchuan Zhou from Analysis and Testing Center, University of Electronic Science and Technology of China, for technical support.
Supplementary material associated with this article can be found, in the online version, at doi:
S. Shen, Y. Chen, J. Zhou, et al., Adv. Ener. Mater. 13 (2023) 2204259. doi: 10.1002/aenm.202204259
S. Shen, Y. Chen, X. Gu, et al., Adv. Mater. 36 (2024) 2400245. doi: 10.1002/adma.202400245
Q. Zhao, X. Chen, W. Hou, et al., SusMat 2 (2022) 104–112. doi: 10.1002/sus2.43
L. Huang, S. Shen, Y. Zhong, et al., Adv. Mater. 34 (2021) 2107415.
M. Liu, J. Xu, L. Shao, et al., Chem. Commun. 60 (2024) 6860–6872. doi: 10.1039/d4cc01974a
T. Tang, C. Li, S. Li, et al., Chin. Chem. Lett. 35 (2024) 109887. doi: 10.1016/j.cclet.2024.109887
C. Zeng, R. Zheng, F. Fan, et al., Energy Stor. Mater. 72 (2024) 103788.
F. Fan, R. Zheng, T. Zeng, et al., Chem. Eng. J. 477 (2023) 147181. doi: 10.1016/j.cej.2023.147181
C. Wang, T. Ouyang, X. Wang, et al., J. Ener. Chem. 99 (2024) 384–392. doi: 10.1016/j.jechem.2024.07.066
C. Zeng, F. Fan, R. Zheng, et al., ACS Appl. Mater. Interfaces 16 (2024) 11377–11388. doi: 10.1021/acsami.3c15370
P. Liu, Z. Qiu, F. Cao, et al., J. Mater. Sci. Technol. 177 (2024) 68–78. doi: 10.1016/j.jmst.2023.09.001
N. Piao, P.F. Wang, L. Chen, et al., Nano Ener. 105 (2023) 108040. doi: 10.1016/j.nanoen.2022.108040
Z. Qiu, S. Shen, P. Liu, et al., Adv. Funct. Mater. 33 (2023) 2214987. doi: 10.1002/adfm.202214987
P. Liu, S. Shen, Z. Qiu, et al., Adv. Mater. 36 (2024) 2312812. doi: 10.1002/adma.202312812
S. Wang, Y. Yang, W. Quan, et al., Nano Ener. 32 (2017) 294–301. doi: 10.1016/j.nanoen.2016.12.052
R. Li, Z. Bai, W. Hou, et al., Chin. Chem. Lett. 34 (2023) 108263. doi: 10.1016/j.cclet.2023.108263
Y. Zhao, Z. Gu, W. Weng, et al., Chin. Chem. Lett. 34 (2023) 107232. doi: 10.1016/j.cclet.2022.02.037
C. Li, C. Zheng, F. Cao, Y. Zhang, X. Xia, J. Electron. Mater. 51 (2022) 4107–4114. doi: 10.1007/s11664-022-09687-4
B. Cao, M. Du, Z. Guo, et al., Carbon Fut. 1 (2024) 9200017. doi: 10.26599/cf.2024.9200017
Y. Cheng, B. Liu, X. Li, et al., Carbon Ener. 6 (2024) e599. doi: 10.1002/cey2.599
P. Zhang, B. Cao, R.A. Soomro, N. Sun, B. Xu, Chin. Chem. Lett. 32 (2021) 282–285. doi: 10.1016/j.cclet.2020.10.006
Y. Ren, F. Meng, S. Zhang, et al., Carbon Ener. 4 (2022) 446–457. doi: 10.1002/cey2.177
J. Wang, Q. Kang, J. Yuan, et al., Carbon Ener. 3 (2021) 153–166. doi: 10.1002/cey2.94
Z. Yao, X. Xia, D. Xie, et al., Adv. Funct. Mater. 28 (2018) 1802756. doi: 10.1002/adfm.201802756
E.F. Rodriguez, F. Xia, D. Chen, A.F. Hollenkamp, R.A. Caruso, J. Mater. Chem. A 4 (2016) 7772–7780. doi: 10.1039/C6TA01954D
K.S. Park, A. Benayad, D.J. Kang, J. Am. Chem. Soc. 130 (2008) 14930–14931. doi: 10.1021/ja806104n
Y. Zhang, B. Ouyang, J. Xu, et al., Angew. Chem. Int. Ed. 55 (2016) 8670–8674. doi: 10.1002/anie.201604372
X. Chang, N. Sun, H. Zhou, R.A. Soomro, B. Xu, Chin. Chem. Lett. 34 (2023) 107312. doi: 10.1016/j.cclet.2022.03.035
Y. Liu, X. Yan, B. Xu, et al., Chem. Eng. J. 361 (2019) 1371–1380. doi: 10.1016/j.cej.2018.10.185
Y.T.M. Tamaki, N. Yamamoto, et al., Plasmas Ions 3 (2000) 33–39. doi: 10.1016/S1288-3255(00)00108-8
J. Wang, L. Yan, B. Liu, et al., Chin. Chem. Lett. 34 (2023) 107526. doi: 10.1016/j.cclet.2022.05.040
Z. Su, S. Li, L. Ma, et al., Adv. Mater. 35 (2022) 2208573.
M. Shahien, M. Yamada, T. Yasui, M. Fukumoto, Surf. Coat. Technol. 216 (2013) 308–317. doi: 10.1016/j.surfcoat.2012.11.062
M.G. Verde, L. Baggetto, N. Balke, et al., ACS Nano 10 (2016) 4312–4321. doi: 10.1021/acsnano.5b07875
Y. Lin, J. Wu, X. Huang, G. Pan, X. Xia, J. Energy Chem. 51 (2020) 372–377. doi: 10.1016/j.jechem.2020.04.037
H. Liu, H. Du, W. Zhao, et al., Energy Stor. Mater. 40 (2021) 490–498.
Y. Zhang, F. Du, X. Yan, et al., ACS Appl. Mater Interfaces 6 (2014) 4458–4465. doi: 10.1021/am5002053

Figure 1 Synthesis and characterization. (a) Fabrication schematics. SEM images and TEM images of (b, e, h) LTO array, (c, f) N-LTO array, and (d, g) TiN@N-LTO array. (i) EDS mapping of TiN@N-LTO.

Figure 2 Structure and composition of samples. (a) XRD patterns. Comparative spectra of LTO array, N-LTO array and TiN@N-LTO array: (b) Survey spectra, (c) N 1s, (d) Ti 2p, (e) O 1s and (f) EPR spectra.

Figure 3 Electrochemical properties of LTO, N-LTO and TiN@N-LTO electrodes for LIBs: (a) CV curves at a scan rate of 0.1 mV/s. (b) Nyquist plots at before cycle. Galvanostatic charge–discharge profiles: (c) Rate performance and (d) at 1 C (enlarged figure in the inset). (e) Relationship between peak current of different scan rate and square root of scan rate. (f) DLi+ versus SOC for GITT and (g) cycling performance at 10 C.

Figure 4 SEM images of different anodes before cycling: (a) N-LTO array, (c) LTO array, (e) TiN@N-LTO array. SEM images of different anodes after cycles: (b) N-LTO array, (d) LTO array, (f) TiN@N-LTO array.

Figure 5 DFT calculation for Bandgap and Li atom adsorption. Bandgap diagrams of (a) LTO, (b) N-doped LTO. (c) UV–vis absorption spectra of LTO, N-LTO and TiN@N-LTO. Inset: The relationship between (αhν)2 and photon energy (hν) which showed the difference in bandgap. (d) The average adsorption energy for Li atom adsorption and (e) the deformation charge density of LTO (111) and TiN (200). (f) Contrast diagram of charge surface density distribution.

 扫一扫看文章

扫一扫关注我们
 DownLoad:
 下载:
下载:
 下载:
下载: